Unit 4 Social interactions
Themes and capstone units
A combination of self-interest, a regard for the wellbeing of others, and appropriate institutions can yield desirable social outcomes when people interact
- Game theory is a way of understanding how people interact based on the constraints that limit their actions, their motives, and their beliefs about what others will do.
- Experiments and other evidence show that self-interest, a concern for others, and a preference for fairness are all important motives that explain how people interact.
- In most interactions there is some conflict of interest between people, but also some opportunity for mutual gain.
- The pursuit of self-interest can sometimes lead to results that are considered good by all participants, or outcomes that none of the participants would prefer.
- Self-interest can be harnessed for the general good in markets, by governments limiting the actions that people are free to take, and by one’s peers imposing punishments on actions that lead to bad outcomes.
- A concern for others and for fairness allows us to internalize the effects of our actions on others, and so can contribute to good social outcomes.
The scientific evidence is now overwhelming: climate change presents very serious global risks, and it demands an urgent global response.1
This is the blunt beginning of the executive summary of the Stern Review, published in 2006. The British Chancellor of the Exchequer (finance minister) commissioned a group of economists, led by former World Bank chief economist Sir Nicholas (now Lord) Stern, to assess the evidence for climate change, and to try to understand its economic implications. The Stern Review predicts that the benefits of early action to slow climate change will outweigh the costs of neglecting the issue.
The Fifth Assessment Report by the Intergovernmental Panel on Climate Change (IPCC) agrees. Early action would mean a significant cut in greenhouse gas emissions, by reducing our consumption of energy-intensive goods, a switch to different energy technologies, reducing the impacts of agriculture and land-use change, and an improvement in the efficiency of current technologies.2
But none of this will happen if we pursue what Stern referred to as ‘business as usual’: a scenario in which people, governments and businesses are free to pursue their own pleasures, politics, and profits without taking adequate account of the effect of their actions on others, including future generations.
National governments disagree on the policies that should be adopted. Many nations in the developed world are pressing for strict global controls on carbon emissions, while others, whose economic catch-up has until recently been dependent on coal-burning technologies, have resisted these measures.
- social dilemma
- A situation in which actions taken independently by individuals in pursuit of their own private objectives result in an outcome which is inferior to some other feasible outcome that could have occurred if people had acted together, rather than as individuals.
The problem of climate change is far from unique. It is an example of what is called a social dilemma. Social dilemmas—like climate change—occur when people do not take adequate account of the effects of their decisions on others, whether these are positive or negative.
Social dilemmas occur frequently in our lives. Traffic jams happen when our choice of a way to get around—for example driving alone to work rather than car-pooling—does not take account of the contribution to congestion that we make. Similarly, overusing antibiotics for minor illnesses may help the sick person who takes them recover more quickly, but creates antibiotic-resistant bacteria that have a much more harmful effect on many others.
The Tragedy of the Commons
In 1968, Garrett Hardin, a biologist, published an article about social dilemmas in the journal Science, called ‘The Tragedy of the Commons’. He argued that resources that are not owned by anyone (sometimes called ‘common property’ or ‘common-pool resources’) such as the earth’s atmosphere or fish stocks, are easily overexploited unless we control access in some way. Fishermen as a group would be better off not catching as much tuna, and consumers as a whole would be better off not eating too much of it. Humanity would be better off by emitting less pollutants, but if you, as an individual, decide to cut your consumption, your carbon footprint or the number of tuna you catch will hardly affect the global levels.3
- free ride
- Benefiting from the contributions of others to some cooperative project without contributing oneself.
Examples of Hardin’s tragedies and other social dilemmas are all around us: if you live with roommates, or in a family, you know just how difficult it is to keep a clean kitchen or bathroom. When one person cleans, everyone benefits, but it is hard work. Whoever cleans up bears this cost. The others are sometimes called free riders. If as a student you have ever done a group assignment, you understand that the cost of effort (to study the problem, gather evidence, or write up the results) is individual, yet the benefits (a better grade, higher class standing, or simply the admiration of classmates) go to the whole group.4
Resolving social dilemmas
There is nothing new about social dilemmas; we have been facing them since prehistory.
- altruism
- The willingness to bear a cost in order to benefit somebody else.
More than 2,500 years ago, the Greek storyteller Aesop wrote about a social dilemma in his fable Belling the Cat. A group of mice needs one of its members to place a bell around a cat’s neck. Once the bell is on, the cat cannot catch and eat the other mice. But the outcome may not be so good for the mouse that takes the job.5 There are countless examples during wars or natural catastrophes in which individuals sacrifice their lives for others who are not family members, and may even be total strangers. These actions are termed altruistic.
Altruistic self-sacrifice is not the most important way that societies resolve social dilemmas and reduce free riding. Sometimes the problems can be resolved by government policies. For example, governments have successfully imposed quotas to prevent the over-exploitation of stocks of cod in the North Atlantic. In the UK, the amount of waste that is dumped in landfills, rather than being recycled, has been dramatically reduced by a landfill tax.
Local communities also create institutions to regulate behaviour. Irrigation communities need people to work to maintain the canals that benefit the whole community. Individuals also need to use scarce water sparingly so that other crops will flourish, although this will lead to smaller crops for themselves. In Valencia, Spain, communities of farmers have used a set of customary rules for centuries to regulate communal tasks and to avoid using too much water. Since the middle ages they have had an arbitration court called the Tribunal de las Aguas (Water Court) that resolves conflicts between farmers about the application of the rules. The ruling of the Tribunal is not legally enforceable. Its power comes only from the respect of the community, yet its decisions are almost universally followed.
- game theory
- A branch of mathematics that studies strategic interactions, meaning situations in which each actor knows that the benefits they receive depend on the actions taken by all. See also: game.
- social interactions
- Situations in which the actions taken by each person affect other people’s outcomes as well as their own.
Even present-day global environmental problems have sometimes been tackled effectively. The Montreal Protocol has been remarkably successful. It was created to phase out and eventually ban the chlorofluorocarbons (CFCs) that threatened to destroy the ozone layer that protects us against harmful ultraviolet radiation.
In this unit, we will use the tools of game theory to model social interactions, in which the decisions of individuals affect other people as well as themselves. We will look at situations that result in social dilemmas and how people can sometimes solve them—but sometimes not (or not yet), as in the case of climate change.
But not all social interactions lead to social dilemmas, even if individuals act in pursuit of their own interests. We will start in the next section with an example where the ‘invisible hand’ of the market, as described by Adam Smith, channels self-interest so that individuals acting independently do reach a mutually beneficial outcome.
Exercise 4.1 Social dilemmas
Using the news headlines from last week:
- Identify two social dilemmas that have been reported (try to use examples not discussed above).
- For each, specify how it satisfies the definition of a social dilemma.
4.1 Social interactions: Game theory
On which side of the road should you drive? If you live in Japan, the UK, or Indonesia, you drive on the left. If you live in South Korea, France, or the US, you drive on the right. If you grew up in Sweden, you drove on the left until 5 p.m. on 3 September 1967, and at 5.01 p.m. you started driving on the right. The government sets a rule, and we follow it.
But suppose we just left the choice to drivers to pursue their self-interest and to select one side of the road or the other. If everyone else was already driving on the right, self-interest (avoiding a collision) would be sufficient to motivate a driver to drive on the right as well. Concern for other drivers, or a desire to obey the law, would not be necessary.
Devising policies to promote people’s wellbeing requires an understanding of the difference between situations in which self-interest can promote general wellbeing, and cases in which it leads to undesirable results. To analyse this, we will introduce game theory, a way of modelling how people interact.
In Unit 3 we saw how a student deciding how much to study and a farmer choosing how hard to work both faced a set of feasible options, determined by a production function. This person then makes decisions to obtain the best possible outcome. But in the models we have studied so far, the outcome did not depend on what anyone else did. Neither the student nor the farmer was engaged in a social interaction.
Social and strategic interactions
- strategic interaction
- A social interaction in which the participants are aware of the ways that their actions affect others (and the ways that the actions of others affect them).
- strategy
- An action (or a course of action) that a person may take when that person is aware of the mutual dependence of the results for herself and for others. The outcomes depend not only on that person’s actions, but also on the actions of others.
- game
- A model of strategic interaction that describes the players, the feasible strategies, the information that the players have, and their payoffs. See also: game theory.
In this unit, we consider social interactions, meaning situations in which there are two or more people, and the actions taken by each person affects both their own outcome and other people’s outcomes. For example, one person’s choice of how much to heat his or her home will affect everyone’s experience of global climate change.
We use four terms:
- When people are engaged in a social interaction and are aware of the ways that their actions affect others, and vice versa, we call this a strategic interaction.
- A strategy is defined as an action (or a course of action) that a person may take when that person is aware of the mutual dependence of the results for herself and for others. The outcomes depend not only on that person’s actions, but also on the actions of others.
- Models of strategic interactions are described as games.
- Game theory is a set of models of strategic interactions. It is widely used in economics and elsewhere in the social sciences.
To see how game theory can clarify strategic interactions, imagine two farmers, who we will call Anil and Bala. They face a problem: should they grow rice or cassava? We assume that they have the ability to grow both types of crop, but can only grow one type at a time.
- division of labour
- The specialization of producers to carry out different tasks in the production process. Also known as: specialization.
Anil’s land is better suited for growing cassava, while Bala’s is better suited for rice. The two farmers have to determine the division of labour, that is, who will specialize in which crop. They decide this independently, which means they do not meet together to discuss a course of action.
(Assuming independence may seem odd in this model of just two farmers, but later we apply the same logic to situations like climate change, in which hundreds or even millions of people interact, most of them total strangers to one another. So assuming that Anil and Bala do not come to some common agreement before taking action is useful for us.)
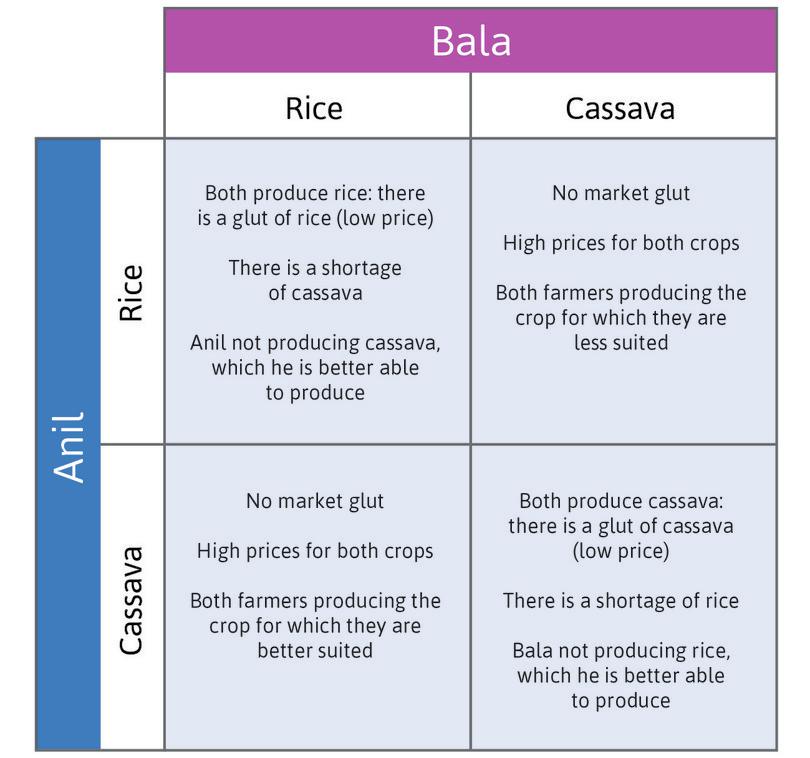
They both sell whatever crop they produce in a nearby village market. On market day, if they bring less rice to the market, the price will be higher. The same goes for cassava. Figure 4.1 describes their interaction, which is what we call a game. Let’s explain what Figure 4.1 means, because you will be seeing this a lot.
Game
A description of a social interaction, which specifies:
- The players: Who is interacting with whom
- The feasible strategies: Which actions are open to the players
- The information: What each player knows when making their decision
- The payoffs: What the outcomes will be for each of the possible combinations of actions
Anil’s choices are the rows of the table and Bala’s are the columns. We call Anil the ‘row player’ and Bala the ‘column player’.
When an interaction is represented in a table like Figure 4.1, each entry describes the outcome of a hypothetical situation. For example, the upper-left cell should be interpreted as:
Suppose (for whatever reason) Anil planted rice and Bala planted rice too. What would we see?
There are four possible hypothetical situations. Figure 4.1 describes what would happen in each case.
Social interactions in the invisible hand game.
Social interactions in the invisible hand game.
Figure 4.1 Social interactions in the invisible hand game.
To simplify the model, we assume that:
- There are no other people involved or affected in any way.
- The selection of which crop to grow is the only decision that Anil and Bala need to make.
- Anil and Bala will interact just once (this is called a ‘one-shot game’).
- They decide simultaneously. When a player makes a decision, that player doesn’t know what the other person has decided to do.
- payoff
- The benefit to each player associated with the joint actions of all the players.
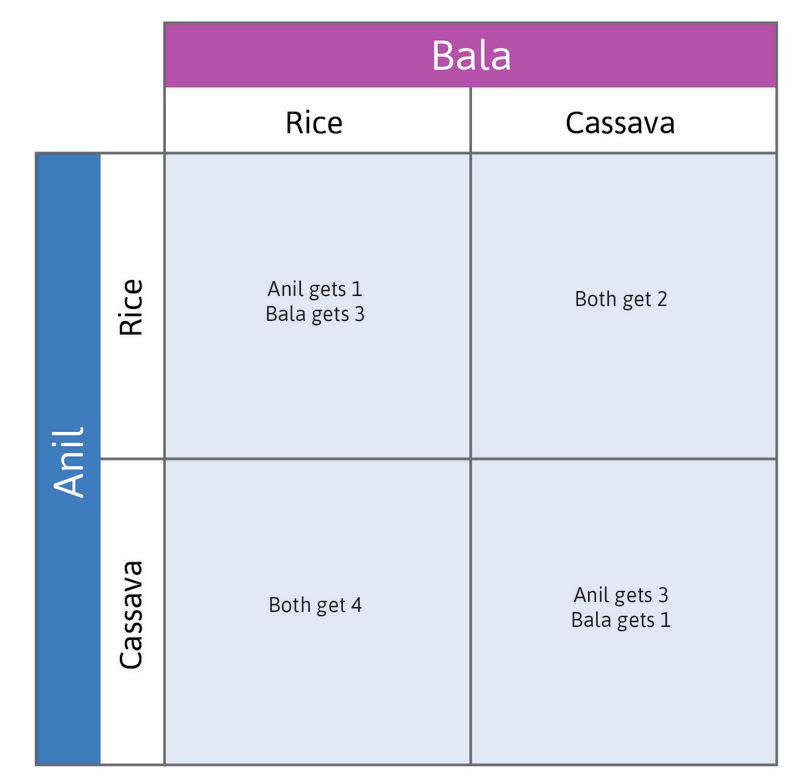
Figure 4.2a shows the payoffs for Anil and Bala in each of the four hypothetical situations—the incomes they would receive if the hypothetical row and column actions were taken. Since their incomes depend on the market prices, which in turn depend on their decisions, we have called this an ‘invisible hand’ game.
The payoffs in the invisible hand game.
The payoffs in the invisible hand game.
Figure 4.2a The payoffs in the invisible hand game.
- Because the market price falls when it is flooded with one crop, they can do better if they specialize compared to when they both produce the same good.
- When they produce different goods they would both do better if each person specialized in the crop that was most suitable for their land.
Question 4.1 Choose the correct answer(s)
In a simultaneous one-shot game:
- A simultaneous game (as opposed to a sequential game) means that players all make a decision on their action simultaneously.
- In a one-shot game (as opposed to a repeated game), there is no ‘future’. The actions are taken only once.
- The players take actions non-cooperatively, driven by self-interest.
- An essential element of strategic games is that each player takes into account the possible actions of other players, when the actual choices made are unknown.
4.2 Equilibrium in the invisible hand game
- best response
- In game theory, the strategy that will give a player the highest payoff, given the strategies that the other players select.
Game theory describes social interactions, but it may also provide predictions about what will happen. To predict the outcome of a game, we need another concept: best response. This is the strategy that will give a player the highest payoff, given the strategies the other players select.
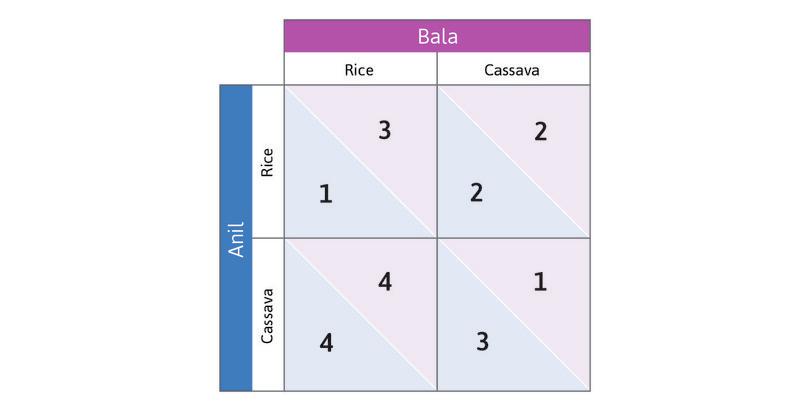
In Figure 4.2b we represent the payoffs for Anil and Bala in the invisible hand game using a standard format called a payoff matrix. A matrix is just any rectangular (in this case square) array of numbers. The first number in each box is the reward received by the row player (whose name begins with A as a reminder that his payoff is first). The second number is the column player’s payoff.
Think about best responses in this game. Suppose you are Anil, and you consider the hypothetical case in which Bala has chosen to grow rice. Which response yields you the higher payoff? You would grow cassava (in this case, you—Anil—would get a payoff of 4, but you would get a payoff of only 1 if you grew rice instead).
- dominant strategy
- Action that yields the highest payoff for a player, no matter what the other players do.
Work through the steps in Figure 4.2b to see that choosing Cassava is also Anil’s best response if Bala chooses Cassava. So Cassava is Anil’s dominant strategy: it will give him the highest payoff, whatever Bala does. And you will see that in this game Bala also has a dominant strategy. The analysis also gives you a handy method for keeping track of best responses by placing dots and circles in the payoff matrix.

The payoff matrix in the invisible hand game.
The payoff matrix in the invisible hand game.
Figure 4.2b The payoff matrix in the invisible hand game.
Finding best responses
Begin with the row player (Anil) and ask: ‘What would be his best response to the column player’s (Bala’s) decision to play Rice?’
Figure 4.2b(a) Begin with the row player (Anil) and ask: ‘What would be his best response to the column player’s (Bala’s) decision to play Rice?’

Anil’s best response if Bala grows rice
If Bala chooses Rice, Anil’s best response is to choose Cassava—that gives him 4, rather than 1. Place a dot in the bottom left-hand cell. A dot in a cell means that this is the row player’s best response.
Figure 4.2b(b) If Bala chooses Rice, Anil’s best response is to choose Cassava—that gives him 4, rather than 1. Place a dot in the bottom left-hand cell. A dot in a cell means that this is the row player’s best response.

Anil’s best response if Bala grows cassava
If Bala chooses Cassava, Anil’s best response is to choose Cassava too—giving him 3, rather than 2. Place a dot in the bottom right-hand cell.
Figure 4.2b(c) If Bala chooses Cassava, Anil’s best response is to choose Cassava too—giving him 3, rather than 2. Place a dot in the bottom right-hand cell.

Anil has a dominant strategy
Both dots are on the bottom row. Whatever Bala’s choice, Anil’s best response is to choose Cassava. Cassava is a dominant strategy for Anil.
Figure 4.2b(d) Both dots are on the bottom row. Whatever Bala’s choice, Anil’s best response is to choose Cassava. Cassava is a dominant strategy for Anil.

Now find the column player’s best responses
If Anil chooses Rice, Bala’s best response is to choose Rice (3 rather than 2). Circles represent the column player’s best responses. Place a circle in the upper left-hand cell.
Figure 4.2b(e) If Anil chooses Rice, Bala’s best response is to choose Rice (3 rather than 2). Circles represent the column player’s best responses. Place a circle in the upper left-hand cell.

Bala has a dominant strategy too
If Anil chooses Cassava, Bala’s best response is again to choose Rice (he gets 4 rather than 3). Place a circle in the lower left-hand cell. Rice is Bala’s dominant strategy (both circles are in the same column).
Figure 4.2b(f) If Anil chooses Cassava, Bala’s best response is again to choose Rice (he gets 4 rather than 3). Place a circle in the lower left-hand cell. Rice is Bala’s dominant strategy (both circles are in the same column).
Both players will play their dominant strategies
We predict that Anil will choose Cassava and Bala will choose Rice because that is their dominant strategy. Where the dot and circle coincide, the players are both playing best responses to each other.
Figure 4.2b(g) We predict that Anil will choose Cassava and Bala will choose Rice because that is their dominant strategy. Where the dot and circle coincide, the players are both playing best responses to each other.
Because both players have a dominant strategy, we have a simple prediction about what each will do: play their dominant strategy. Anil will grow cassava, and Bala will grow rice.
- dominant strategy equilibrium
- An outcome of a game in which every player plays his or her dominant strategy.
This pair of strategies is a dominant strategy equilibrium of the game.
Remember from Unit 2 that an equilibrium is a self-perpetuating situation. Something of interest does not change. In this case, Anil choosing Cassava and Bala choosing Rice is an equilibrium because neither of them would want to change their decision after seeing what the other player chose.
If we find that both players in a two-player game have dominant strategies, the game has a dominant strategy equilibrium. As we will see later, this does not always happen. But when it does, we predict that these are the strategies that will be played.
Because both Anil and Bala have a dominant strategy, their choice of crop is not affected by what they expect the other person to do. This is similar to the models in Unit 3 in which Alexei’s choice of hours of study, or Angela’s working hours, did not depend on what others did. But here, even though the decision does not depend on what the others do, the payoff does. For example, if Anil is playing his dominant strategy (Cassava) he is better off if Bala plays Rice than if Bala plays Cassava as well.
In the dominant strategy equilibrium Anil and Bala have specialized in producing the good for which their land is better suited. Simply pursuing their self-interest—choosing the strategy for which they got the highest payoff—resulted in an outcome that was:
- the best of the four possible outcomes for each player
- the strategy that yielded the largest total payoffs for the two farmers combined
In this example, the dominant strategy equilibrium is the outcome that each would have chosen if they had a way of coordinating their decisions. Although they independently pursued their self-interest, they were guided ‘as if by an invisible hand’ to an outcome that was in both of their best interests.
Real economic problems are never this simple, but the basic logic is the same. The pursuit of self-interest without regard for others is sometimes considered to be morally bad, but the study of economics has identified cases in which it can lead to outcomes that are socially desirable. There are other cases, however, in which the pursuit of self-interest leads to results that are not in the self-interest of any of the players. The prisoners’ dilemma game, which we study next, describes one of these situations.
Question 4.2 Choose the correct answer(s)
Brian likes going to the cinema more than watching football. Anna, on the other hand, prefers watching football to going to the cinema. Either way, they both prefer to be together rather than spending an afternoon apart. The following table represents the happiness levels (payoffs) of Anna and Brian, depending on their choice of activity (the first number is Brian’s happiness level while the second number is Anna’s):

Based on the information above, we can conclude that:
- For Brian, the dominant strategy is Cinema.
- The dominant strategy equilibrium is the outcome in which each player plays his/her dominant strategy. In this game it is (Cinema, Football), with the payoff (4, 3).
- Anna would attain the highest happiness level if they could go to the cinema together. Similarly, Brian would be happiest if they both watched football.
- (Cinema, Football) is a dominant strategy equilibrium. The lack of any incentive to deviate is a feature of any dominant strategy equilibrium.
When economists disagree Homo economicus in question: Are people entirely selfish?
For centuries, economists and just about everyone else have debated whether people are entirely self-interested or are sometimes happy to help others even when it costs them something to do so. Homo economicus (economic man) is the nickname given to the selfish and calculating character that you find in economics textbooks. Have economists been right to imagine homo economicus as the only actor on the economic stage?
In the same book in which he first used the phrase ‘invisible hand’, Adam Smith also made it clear that he thought we were not homo economicus: ‘How selfish soever man may be supposed, there are evidently some principles in his nature which interest him in the fortunes of others, and render their happiness necessary to him, though he derives nothing from it except the pleasure of seeing it.’ (The Theory of Moral Sentiments, 1759)
But most economists since Smith have disagreed. In 1881, Francis Edgeworth, a founder of modern economics, made this perfectly clear in his book Mathematical Psychics: ‘The first principle of economics is that every agent is actuated only by self-interest.’6
Yet everyone has experienced, and sometimes even performed, great acts of kindness or bravery on behalf of others in situations in which there was little chance of a reward. The question for economists is: should the unselfishness evident in these acts be part of how we reason about behaviour?
Some say ‘no’: many seemingly generous acts are better understood as attempts to gain a favourable reputation among others that will benefit the actor in the future.
Maybe helping others and observing social norms is just self-interest with a long time horizon. This is what the essayist H. L. Mencken thought: ‘conscience is the inner voice which warns that somebody may be looking.’7
Since the 1990s, in an attempt to resolve the debate on empirical grounds, economists have performed hundreds of experiments all over the world in which the behaviour of individuals (students, farmers, whale hunters, warehouse workers, and CEOs) can be observed as they make real choices about sharing, using economic games.
- reciprocity
- A preference to be kind or to help others who are kind and helpful, and to withhold help and kindness from people who are not helpful or kind.
- inequality aversion
- A dislike of outcomes in which some individuals receive more than others.
In these experiments, we almost always see some self-interested behaviour. But we also observe altruism, reciprocity, aversion to inequality, and other preferences that are different from self-interest. In many experiments homo economicus is the minority. This is true even when the amounts being shared (or kept for oneself) amount to many days’ wages.
Is the debate resolved? Many economists think so and now consider people who are sometimes altruistic, sometimes inequality averse, and sometimes reciprocal, in addition to homo economicus. They point out that the assumption of self-interest is appropriate for many economic settings, like shopping or the way that firms use technology to maximize profits. But it’s not as appropriate in other settings, such as how we pay taxes, or why we work hard for our employer.
4.3 The prisoners’ dilemma
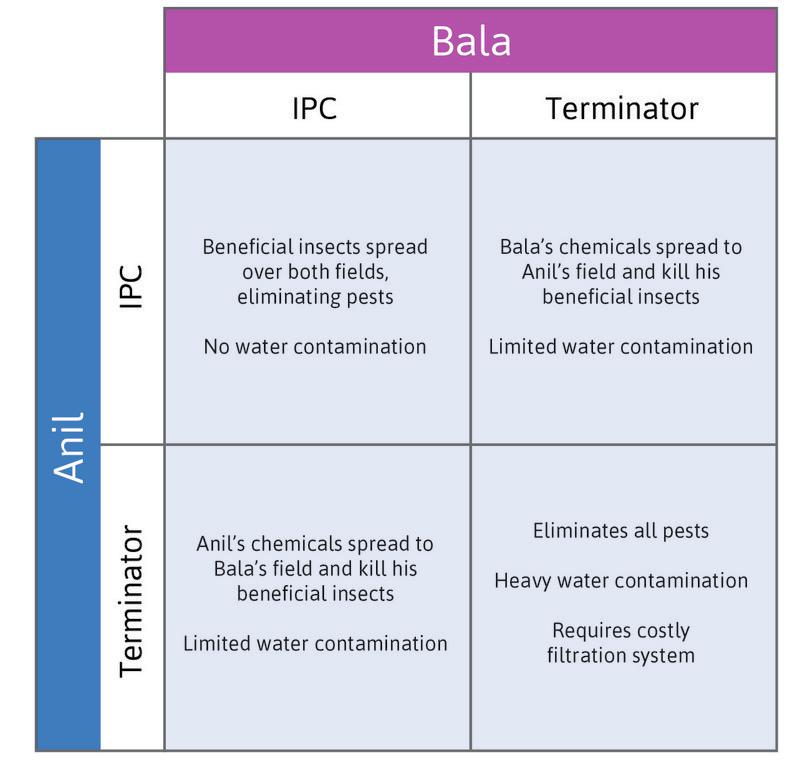
Imagine that Anil and Bala are now facing a different problem. Each is deciding how to deal with pest insects that destroy the crops they cultivate in their adjacent fields. Each has two feasible strategies:
- The first is to use an inexpensive chemical called Terminator. It kills every insect for miles around. Terminator also leaks into the water supply that they both use.
- The second is to use integrated pest control (IPC) instead of a chemical. A farmer using IPC introduces beneficial insects to the farm. The beneficial insects eat the pest insects.
If just one of them chooses Terminator, the damage is quite limited. If they both choose it, water contamination becomes a serious problem, and they need to buy a costly filtering system. Figures 4.3a and 4.3b describe their interaction.
Social interactions in the pest control game.
Social interactions in the pest control game.
Figure 4.3a Social interactions in the pest control game.
Both Anil and Bala are aware of these outcomes. As a result, they know that their payoff (the amount of money they will make at harvest time, minus the costs of their pest control strategy and the installation of water filtration if that becomes necessary), will depend not only on what choice they make, but also on the other’s choice. This is a strategic interaction.
Payoff matrix for the pest control game.
Payoff matrix for the pest control game.
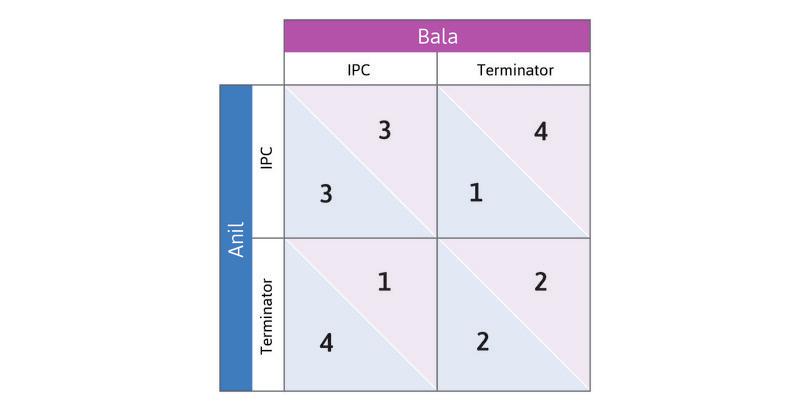
Figure 4.3b Payoff matrix for the pest control game.
How will they play the game? To figure this out, we can use the same method as in the previous section (draw the dots and circles in the payoff matrix for yourself).
Anil’s best responses:
- If Bala chooses IPC: Terminator (cheap eradication of pests, with little water contamination).
- If Bala chooses Terminator: Terminator (IPC costs more and cannot work since Bala’s chemicals will kill beneficial pests).
So Terminator is Anil’s dominant strategy.
You can check, similarly, that Terminator is also a dominant strategy for Bala.
Because Terminator is the dominant strategy for both, we predict that both will use it. Both players using insecticide is the dominant strategy equilibrium of the game.
- prisoners’ dilemma
- A game in which the payoffs in the dominant strategy equilibrium are lower for each player, and also lower in total, than if neither player played the dominant strategy.
Anil and Bala each receive payoffs of 2. But both would be better off if they both used IPC instead. So the predicted outcome is not the best feasible outcome. The pest control game is a particular example of a game called the prisoners’ dilemma.
The prisoners’ dilemma
The name of this game comes from a story about two prisoners (we call them Thelma and Louise) whose strategies are either to Accuse (implicate) the other in a crime that the prisoners may have committed together, or Deny that the other prisoner was involved.
If both Thelma and Louise deny it, they are freed after a few days of questioning.
If one person accusing the other person, while the other person denies, the accuser will be freed immediately (a sentence of zero years), whereas the other person gets a long jail sentence (10 years).
Lastly, if both Thelma and Louise choose Accuse (meaning each implicates the other), they both get a jail sentence. This sentence is reduced from 10 years to 5 years because of their cooperation with the police. The payoffs of the game are shown in Figure 4.4.

![Prisoners’ dilemma (payoffs are years in prison).: Prisoners’ dilemma (payoffs are years in prison).]()
Prisoners’ dilemma (payoffs are years in prison).
Prisoners’ dilemma (payoffs are years in prison).
Figure 4.4 Prisoners’ dilemma (payoffs are years in prison).
(The payoffs are written in terms of years of prison—so Louise and Thelma prefer lower numbers.)
In a prisoners’ dilemma, both players have a dominant strategy (in this example, Accuse) which, when played by both, results in an outcome that is worse for both than if they had both adopted a different strategy (in this example, Deny).
Our story about Thelma and Louise is hypothetical, but this game applies to many real problems. For example, watch the clip from a TV quiz show called Golden Balls, and you will see how one ordinary person ingeniously resolves the prisoners’ dilemma.
In economic examples, the mutually beneficial strategy (Deny) is generally termed Cooperate, while the dominant strategy (Accuse) is called Defect. Cooperate does not mean that players get together and discuss what to do. The rules of the game are always that each player decides independently on a strategy.

The contrast between the invisible hand game and the prisoners’ dilemma shows that self-interest can lead to favourable outcomes, but can also lead to outcomes that nobody would endorse. Such examples can help us understand more precisely how markets can harness self-interest to improve the workings of the economy, but also the limitations of markets.
Three aspects of the interaction between Anil and Bala caused us to predict an unfortunate outcome in their prisoners’ dilemma game:
- They did not place any value on the payoffs of the other person, and so did not internalize (take account of) the costs that their actions inflicted on the other.
- There was no way that Anil, Bala or anyone else could make the farmer who used the insecticide pay for the harm that it caused.
- They were not able to make an agreement beforehand about what each would do. Had they been able to do so, they could have simply agreed to use IPC, or banned the use of Terminator.
If we can overcome one or more of these problems, the outcome preferred by both of them would sometimes result. So, in the rest of this unit, we will examine ways to do this.
Question 4.3 Choose the correct answer(s)
Dimitrios and Ameera work for an international investment bank as foreign exchange traders. They are being questioned by the police on their suspected involvement in a series of market manipulation trades. The table below shows the cost of each strategy (in terms of the length in years of jail sentences they will receive), depending on whether they accuse each other or deny the crime. The first number is the payoff to Dimitrios, while the second number is the payoff to Ameera (the negative numbers signify losses). Assume that the game is a simultaneous one-shot game.

Based on this information, we can conclude that:
- Denying is a dominated strategy for both Dimitrios and Ameera, so they will Accuse.
- For both Dimitrios and Ameera, Accusing is a dominant strategy. Therefore, the outcome in which they both Accuse and end up with 8-year sentences is a dominant strategy equilibrium.
- Accusing is Ameera’s best response regardless of what Dimitrios does, so she will always Accuse. It is a dominant strategy.
- This outcome can only happen if both Dimitrios and Ameera Deny. Denying is a dominated strategy for both of them, so this would never happen.
Exercise 4.2 Political advertising
Many people consider political advertising (campaign advertisements) to be a classic example of a prisoners’ dilemma.
- Using examples from a recent political campaign with which you are familiar, explain whether this is the case.
- Write down an example payoff matrix for this case.
4.4 Social preferences: Altruism
When students play one-shot prisoners’ dilemma games in classroom or laboratory experiments—sometimes for substantial sums of real money—it is common to observe half or more of the participants playing the Cooperate rather than Defect strategy, despite mutual defection being the dominant strategy for players who care only about their own monetary payoffs. One interpretation of these results is that players are altruistic.
For example, if Anil had cared sufficiently about the harm that he would inflict on Bala by using Terminator when Bala was using IPC, then IPC would have been Anil’s best response to Bala’s IPC. And if Bala had felt the same way, then IPC would have been a mutual best response, and the two would no longer have been in a prisoners’ dilemma.
A person who is willing to bear a cost in order to help another person is said to have altruistic preferences. In the example just given, Anil was willing to give up 1 payoff unit because that would have imposed a loss of 2 on Bala. His opportunity cost of choosing IPC when Bala had chosen IPC was 1, and it conferred a benefit of 2 on Bala, meaning that he had acted altruistically.
- social preferences
- Preferences that place a value on what happens to other people, and on acting morally, even if it results in lower payoffs for the individual.
The economic models we used in Unit 3 assumed self-interested preferences: Alexei, the student, and Angela, the farmer, cared about their own free time and their own grades or consumption. People generally do not care only about what happens to themselves, but also what happens to others. Then we say that the individual has social preferences. Altruism is an example of a social preference. Spite and envy are also social preferences.
Altruistic preferences as indifference curves
In previous units, we used indifference curves and feasible sets to model Alexei’s and Angela’s behaviour. We can do the same to study how people interact when social preferences are part of their motivation.
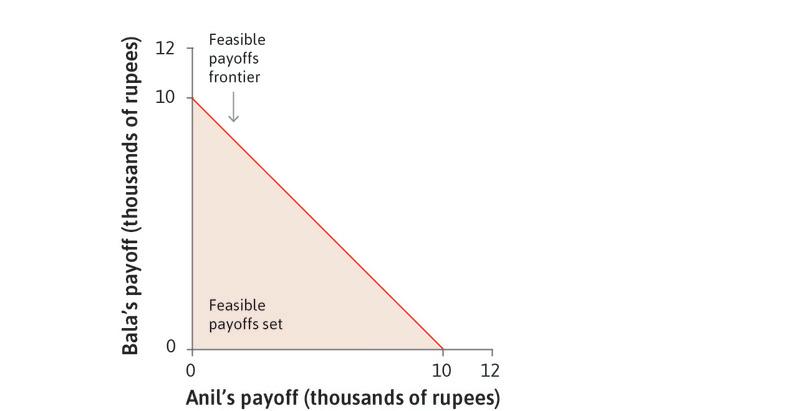
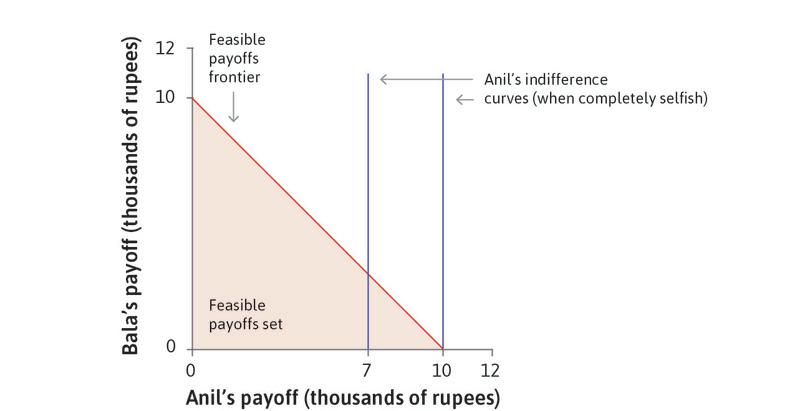
Imagine the following situation. Anil was given some tickets for the national lottery, and one of them won a prize of 10,000 rupees. He can, of course, keep all the money for himself, but he can also share some of it with his neighbour Bala. Figure 4.5 represents the situation graphically. The horizontal axis represents the amount of money (in thousands of rupees) that Anil keeps for himself, and the vertical one the amount that he gives to Bala. Each point (x, y) represents a combination of amounts of money for Anil (x) and Bala (y) in thousands of rupees. The shaded triangle depicts the feasible choices for Anil. At the corner (10, 0) on the horizontal axis, Anil keeps it all. At the other corner (0, 10) on the vertical axis, Anil gives it all to Bala. Anil’s feasible set is the shaded area.
- zero sum game
- A game in which the payoff gains and losses of the individuals sum to zero, for all combinations of strategies they might pursue.
The boundary of the shaded area is the feasible frontier. If Anil is dividing up his prize money between himself and Bala, he chooses a point on that frontier (being inside the frontier would mean throwing away some of the money). The choice among points on the feasible frontier is called a zero sum game because, when choosing point B rather than point A as in Figure 4.5, the sum of Anil’s losses and Bala’s gains is zero (for example, Anil has 3,000 fewer rupees at B than at A, and Bala has 3,000 rupees at B and nothing at A).
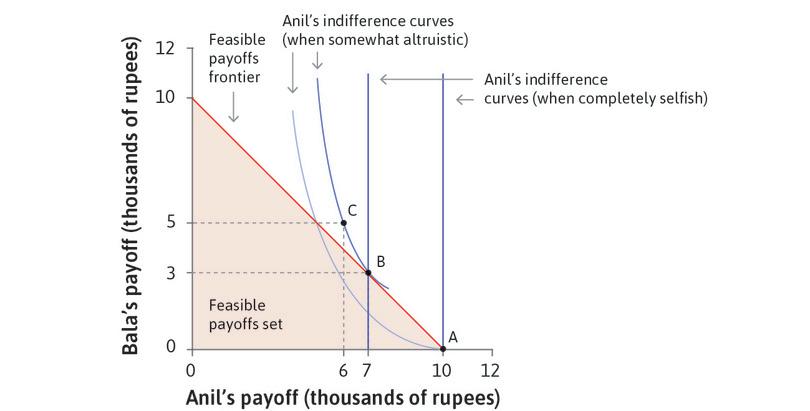
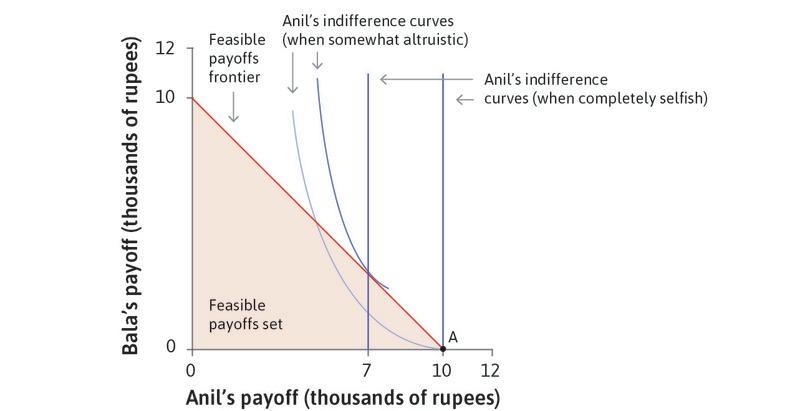
Anil’s preferences can be represented by indifference curves, showing combinations of the amounts for Anil and Bala that are all equally preferred by Anil. Figure 4.5 illustrates two cases. In the first, Anil has self-interested preferences so his indifference curves are straight vertical lines; in the second he is somewhat altruistic—he cares about Bala—so his indifference curves are downward-sloping.
How Anil chooses to distribute his lottery winnings depends on whether he is selfish or altruistic.
How Anil chooses to distribute his lottery winnings depends on whether he is selfish or altruistic.
Figure 4.5 How Anil chooses to distribute his lottery winnings depends on whether he is selfish or altruistic.
Feasible payoffs
Each point (x, y) in the figure represents a combination of amounts of money for Anil (x) and Bala (y), in thousands of rupees. The shaded triangle depicts the feasible choices for Anil.
Figure 4.5a Each point (x, y) in the figure represents a combination of amounts of money for Anil (x) and Bala (y), in thousands of rupees. The shaded triangle depicts the feasible choices for Anil.
Indifference curves when Anil is self-interested
If Anil does not care at all about what Bala gets, his indifference curves are straight vertical lines. He is indifferent to whether Bala gets a lot or nothing. He prefers curves further to the right, since he gets more money.
Figure 4.5b If Anil does not care at all about what Bala gets, his indifference curves are straight vertical lines. He is indifferent to whether Bala gets a lot or nothing. He prefers curves further to the right, since he gets more money.

Anil’s best option
Given his feasible set, Anil’s best option is A, where he keeps all the money.
Figure 4.5c Given his feasible set, Anil’s best option is A, where he keeps all the money.
What if Anil cares about Bala?
But Anil may care about his neighbour Bala, in which case he is happier if Bala is richer: that is, he derives utility from Bala’s consumption. In this case he has downward-sloping indifference curves.
Figure 4.5d But Anil may care about his neighbour Bala, in which case he is happier if Bala is richer: that is, he derives utility from Bala’s consumption. In this case he has downward-sloping indifference curves.
Anil’s indifference curves when he is somewhat altruistic
Points B and C are equally preferred by Anil, so Anil keeping 7 and Bala getting 3 is just as good in Anil’s eyes as Anil getting 6 and Bala getting 5. His best feasible option is point B.
Figure 4.5e Points B and C are equally preferred by Anil, so Anil keeping 7 and Bala getting 3 is just as good in Anil’s eyes as Anil getting 6 and Bala getting 5. His best feasible option is point B.
If Anil is self-interested, the best option given his feasible set is A, where he keeps all the money. If he derives utility from Bala’s consumption, he has downward-sloping indifference curves so he may prefer an outcome where Bala gets some of the money.
Leibniz: Finding the optimal distribution with altruistic preferences
With the specific indifference curves shown in Figure 4.5, the best feasible option for Anil is point B (7, 3) where Anil keeps 7,000 rupees and gives 3,000 to Bala. Anil prefers to give 3,000 rupees to Bala, even at a cost of 3,000 rupees to him. This is an example of altruism: Anil is willing to bear a cost to benefit somebody else.
Exercise 4.3 Altruism and selflessness
Using the same axes as in Figure 4.5:
- What would Anil’s indifference curves look like if he cared just as much about Bala’s consumption as his own?
- What would they look like if he derived utility only from the total of his and Bala’s consumption?
- What would they look like if he derived utility only from Bala’s consumption?
- For each of these cases, provide a real world situation in which Anil might have these preferences, making sure to specify how Anil and Bala derive their payoffs.
Question 4.4 Choose the correct answer(s)
In Figure 4.5 Anil has just won the lottery and has received 10,000 rupees. He is considering how much (if at all) he would like to share this sum with his friend Bala. Before he manages to share his winnings, Anil receives a tax bill for these winnings of 3,000 rupees. Based on this information, which of the following statements is true?
- Without the tax Anil would have given exactly 3,000 rupees to Bala. With the total income now at 7,000 rupees, Anil will choose to give less than this.
- We assume that preferences are fixed. Hence Anil will remain somewhat altruistic and give Bala some of his winnings.
- The tax bill can be depicted as an inward shift of the feasible frontier. Therefore, Anil’s optimal choice will result in him being on a lower indifference curve than before.
- Bala would have received 10,000 and 7,000 rupees respectively before and after the tax bill.
4.5 Altruistic preferences in the prisoners’ dilemma
When Anil and Bala wanted to get rid of pests (Section 4.3), they found themselves in a prisoners’ dilemma. One reason for the unfortunate outcome was that they did not account for the costs that their actions inflicted on the other. The choice of pest control regime using the insecticide implied a free ride on the other farmer’s contribution to ensuring clean water.
If Anil cares about Bala’s wellbeing as well as his own, the outcome can be different.
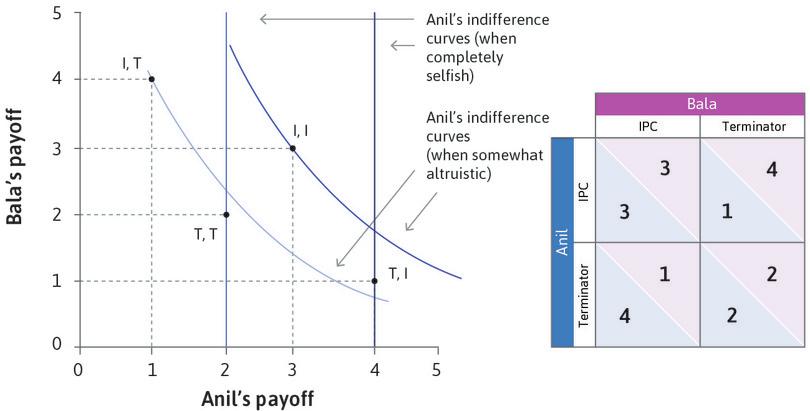
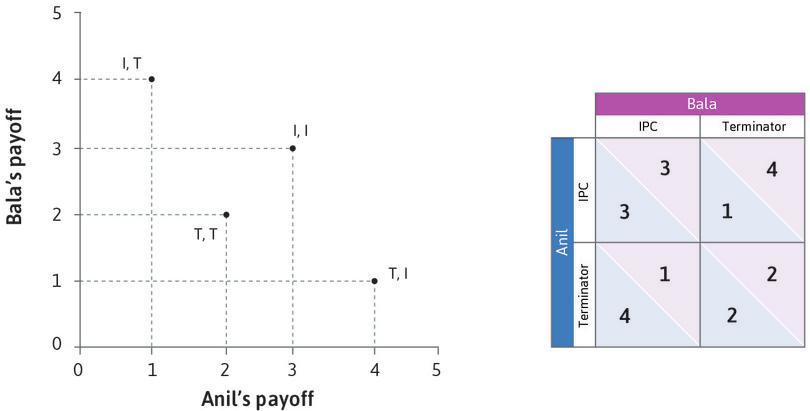
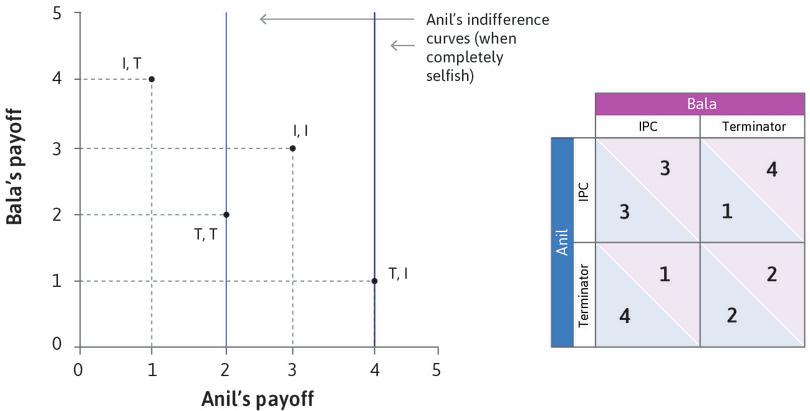
In Figure 4.6 the two axes now represent Anil and Bala’s payoffs. Just as with the example of the lottery, the diagram shows the feasible outcomes. However, in this case the feasible set has only four points. We have shortened the names of the strategies for convenience: Terminator is T, IPC is I. Notice that movements upward and to the right from (T, T) to (I, I) are win-win: both get higher payoffs. On the other hand, moving up, and to the left, or down, and to the right—from (I, T) to (T, I) or the reverse—are win-lose changes. Win-lose means that Bala gets a higher payoff at the expense of Anil, or Anil benefits at the expense of Bala.
As in the case of dividing lottery winnings, we look at two cases. If Anil does not care about Bala’s wellbeing, his indifference curves are vertical lines. If he does care, he has downward-sloping indifference curves. Work through Figure 4.6 to see what will happen in each case.
Anil and Bala’s payoffs
Anil’s decision to use IPC (I) or Terminator (T) as his crop management strategy depends on whether he is completely selfish or somewhat altruistic.
Figure 4.6 Anil’s decision to use IPC (I) or Terminator (T) as his crop management strategy depends on whether he is completely selfish or somewhat altruistic.
Anil and Bala’s payoffs
The two axes in the figure represent Anil and Bala’s payoffs. The four points are the feasible outcomes associated to the strategies.
Figure 4.6a The two axes in the figure represent Anil and Bala’s payoffs. The four points are the feasible outcomes associated to the strategies.
Anil’s indifference curves if he doesn’t care about Bala
If Anil does not care about Bala’s wellbeing, his indifference curves are vertical, so (T, I) is his most preferred outcome. He prefers (T, I) to (I, I), so should choose T if Bala chooses I. If Anil is completely selfish, T is unambiguously his best choice.
Figure 4.6b If Anil does not care about Bala’s wellbeing, his indifference curves are vertical, so (T, I) is his most preferred outcome. He prefers (T, I) to (I, I), so should choose T if Bala chooses I. If Anil is completely selfish, T is unambiguously his best choice.
Anil’s indifference curves when he cares about Bala
When Anil cares about Bala’s wellbeing, indifference curves are downward-sloping and (I, I) is his most preferred outcome. If Bala chooses I, Anil should choose I. Anil should also choose I if Bala chooses T, since he prefers (I, T) to (T, T).
Figure 4.6c When Anil cares about Bala’s wellbeing, indifference curves are downward-sloping and (I, I) is his most preferred outcome. If Bala chooses I, Anil should choose I. Anil should also choose I if Bala chooses T, since he prefers (I, T) to (T, T).
Figure 4.6 demonstrates that when Anil is completely self-interested, his dominant strategy is Terminator (as we saw before). But if Anil cares sufficiently about Bala, his dominant strategy is IPC. If Bala feels the same way, then the two would both choose IPC, resulting in the outcome that both of them prefer the most.
The main lesson is that if people care about one another, social dilemmas are easier to resolve. This helps us understand the historical examples in which people mutually cooperate for irrigation or enforce the Montreal Protocol to protect the ozone layer, rather than free riding on the cooperation of others.
Question 4.5 Choose the correct answer(s)
Figure 4.6 shows Anil’s preferences when he is completely selfish, and also when he is somewhat altruistic, when he and Bala participate in the prisoners’ dilemma game.
Based on the graph, we can say that:
- (T, I) is on a ‘higher’ vertical indifference curve than (I, I) (that is, it is further to the right) and (T, T) is on a higher vertical indifference curve that (I, T). So using Terminator is a dominant strategy for Anil when he is completely selfish.
- When Anil is somewhat altruistic, (I, I) is on a higher indifference curve than (T, I), and (I, T) is on a higher indifference curve than (T, T). So using IPC is Anil’s dominant strategy.
- Terminator is a dominant strategy for both players, so (T, T) is a dominant strategy equilibrium. Anil would prefer (T, I) but Bala will never choose IPC.
- IPC is a dominant strategy for Anil when he is somewhat altruistic. If Bala has the same preferences IPC will be a dominant strategy for him too, so (I, I) is the dominant strategy equilibrium.
Exercise 4.4 Amoral self-interest
Imagine a society in which everyone was entirely self-interested (cared only about his or her own wealth) and amoral (followed no ethical rules that would interfere with gaining that wealth). How would that society be different from the society you live in? Consider the following:
- families
- workplaces
- neighbourhoods
- traffic
- political activity (would people vote?)
4.6 Public goods, free riding, and repeated interaction
Now let’s look at the second reason for an unfortunate outcome in the prisoners’ dilemma game. There was no way that either Anil or Bala (or anyone else) could make whoever used the insecticide pay for the harm that it caused.
The problems of Anil and Bala are hypothetical, but they capture the real dilemmas of free riding that many people around the world face. For example, as in Spain, many farmers in southeast Asia rely on a shared irrigation facility to produce their crops. The system requires constant maintenance and new investment. Each farmer faces the decision of how much to contribute to these activities. These activities benefit the entire community and if the farmer does not volunteer to contribute, others may do the work anyway.
Imagine there are four farmers who are deciding whether to contribute to the maintenance of an irrigation project.
- public good
- A good for which use by one person does not reduce its availability to others. Also known as: non-rival good. See also: non-excludable public good, artificially scarce good.
For each farmer, the cost of contributing to the project is $10. But when one farmer contributes, all four of them will benefit from an increase in their crop yields made possible by irrigation, so they will each gain $8. Contributing to the irrigation project is called a public good: when one individual bears a cost to provide the good, everyone receives a benefit.
Now, consider the decision facing Kim, one of the four farmers. Figure 4.7 shows how her decision depends on her total earnings, but also on the number of other farmers who decide to contribute to the irrigation project.
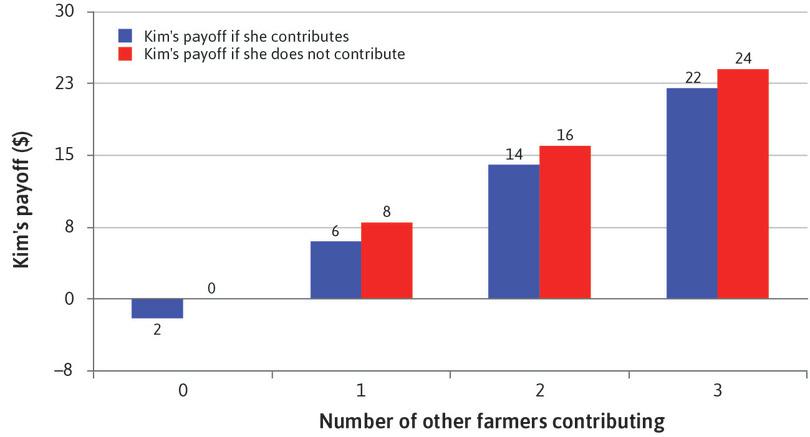
Kim’s payoffs in the public goods game.
Kim’s payoffs in the public goods game.
Figure 4.7 Kim’s payoffs in the public goods game.
For example, if two of the others contribute, Kim will receive a benefit of $8 from each of their contributions. So if she makes no contribution herself, her total payoff, shown in red, is $16. If she decides to contribute, she will receive an additional benefit of $8 (and so will the other three farmers). But she will incur a cost of $10, so her total payoff is $14, as in Figure 4.7, and as calculated in Figure 4.8.
| Benefit from the contribution of others | 16 | |
| Plus benefit from her own contribution | + | 8 |
| Minus cost of her contribution | – | 10 |
| Total | $14 |
Example: When two others contribute, Kim’s payoff is lower if she contributes too.
Example: When two others contribute, Kim’s payoff is lower if she contributes too.
Figure 4.8 Example: When two others contribute, Kim’s payoff is lower if she contributes too.
Figures 4.7 and 4.8 illustrate the social dilemma. Whatever the other farmers decide to do, Kim makes more money if she doesn’t contribute than if she does. Not contributing is a dominant strategy. She can free ride on the contributions of the others.
This public goods game is a prisoners’ dilemma in which there are more than two players. If the farmers care only about their own monetary payoff, there is a dominant strategy equilibrium in which no one contributes and their payoffs are all zero. On the other hand, if all contributed, each would get $22. Everyone would benefit if everyone cooperated, but irrespective of what others do, each farmer does better by free riding on the others.
Altruism could help to solve the free rider problem: if Kim cared about the other farmers, she might be willing to contribute to the irrigation project. But if large numbers of people are involved in a public goods game, it is less likely that altruism will be sufficient to sustain a mutually beneficial outcome.
Yet around the world, real farmers and fishing people have faced public goods situations in many cases with great success. The evidence gathered by Elinor Ostrom, a political scientist, and other researchers on common irrigation projects in India, Nepal, and other countries, shows that the degree of cooperation varies. In some communities a history of trust encourages cooperation. In others, cooperation does not happen. In south India, for example, villages with extreme inequalities in land and caste status had more conflicts over water usage. Less unequal villages maintained irrigation systems better: it was easier to sustain cooperation.8
Great economists Elinor Ostrom
The choice of Elinor Ostrom (1933–2012), a political scientist, as a co-recipient of the 2009 Nobel Prize surprised most economists. For example, Steven Levitt, a professor at the University of Chicago, admitted he knew nothing about her work, and had ‘no recollection of ever seeing or hearing her name mentioned by an economist’.
Some, however, vigorously defended the decision. Vernon Smith, an experimental economist who had previously been awarded the Prize, congratulated the Nobel committee for recognizing her originality, ‘scientific common sense’ and willingness to listen ‘carefully to data’.
Ostrom’s entire academic career was focused on a concept that plays a central role in economics but is seldom examined in much detail: property. Ronald Coase had established the importance of clearly delineated property rights when one person’s actions affected the welfare of others. But Coase’s main concern was the boundary between the individual and the state in regulating such actions. Ostrom explored the middle ground where communities, rather than individuals or formal governments, held property rights.
The conventional wisdom at the time was that informal collective ownership of resources would lead to a ‘tragedy of the commons’. That is, economists believed that resources could not be used efficiently and sustainably under a common property regime. Thanks to Elinor Ostrom this is no longer a dominant view.
First, she made a distinction between resources held as common property and those subject to open access:
- Common property involves a well-defined community of users who are able in practice, if not under the law, to prevent outsiders from exploiting the resource. Inshore fisheries, grazing lands, or forest areas are examples.
- Open-access resources such as ocean fisheries or the atmosphere as a carbon sink, can be exploited without restrictions, other than those imposed by states acting alone or through international agreements.
- social norm
- An understanding that is common to most members of a society about what people should do in a given situation when their actions affect others.
Ostrom was not alone in stressing this distinction, but she drew on a unique combination of case studies, statistical methods, game theoretic models with unorthodox ingredients, and laboratory experiments to try to understand how tragedies of the commons could be averted.
She discovered great diversity in how common property is managed. Some communities were able to devise rules and draw on social norms to enforce sustainable resource use, while others failed to do so. Much of her career was devoted to identifying the criteria for success, and using theory to understand why some arrangements worked well while others did not.
Many economists believed that the diversity of outcomes could be understood using the theory of repeated games, which predicts that even when all individuals care only for themselves, if interactions are repeated with sufficiently high likelihood and individuals are patient enough, then cooperative outcomes can be sustained indefinitely.
But this was not a satisfying explanation for Ostrom, partly because the same theory predicted that any outcome, including rapid depletion, could also arise.
More importantly, Ostrom knew that sustainable use was enforced by actions that clearly deviated from the hypothesis of material self-interest. In particular, individuals would willingly bear considerable costs to punish violators of rules or norms. As the economist Paul Romer put it, she recognized the need to ‘expand models of human preferences to include a contingent taste for punishing others’.
Ostrom developed simple game theoretic models in which individuals have unorthodox preferences, caring directly about trust and reciprocity. And she looked for the ways in which people faced with a social dilemma avoided tragedy by changing the rules so that the strategic nature of the interaction was transformed.
She worked with economists to run a pioneering series of experiments, confirming the widespread use of costly punishment in response to excessive resource extraction, and also demonstrated the power of communication and the critical role of informal agreements in supporting cooperation. Thomas Hobbes, a seventeenth-century philosopher, had asserted that agreements had to be enforced by governments, since ‘covenants, without the sword, are but words and of no strength to secure a man at all’. Ostrom disagreed. As she wrote in the title of an influential article, covenants—even without a sword—make self-governance possible.9
Social preferences partly explain why these communities avoid Garrett Hardin’s tragedy of the commons. But they may also find ways of deterring free-riding behaviour.
Repeated games
Free riding today on the contributions of other members of one’s community may have unpleasant consequences tomorrow or years from now. Ongoing relationships are an important feature of social interactions that was not captured in the models we have used so far: life is not a one-shot game.
The interaction between Anil and Bala in our model was a one-shot game. But as owners of neighbouring fields, Anil and Bala are more realistically portrayed as interacting repeatedly.
Imagine how differently things would work out if we represented their interaction as a game to be repeated each season. Suppose that Bala has adopted IPC. What is Anil’s best response? He would reason like this:
- Anil
- If I play IPC, then maybe Bala will continue to do so, but if I use Terminator—which would raise my profits this season—Bala would use Terminator next year. So unless I am extremely impatient for income now, I’d better stick with IPC.
Bala could reason in exactly the same way. The result might be that they would then continue playing IPC forever.
In the next section, we will look at experimental evidence of how people behave when a public goods game is repeated.
Question 4.6 Choose the correct answer(s)
Four farmers are deciding whether to contribute to the maintenance of an irrigation project. For each farmer, the cost of contributing to the project is $10. But when one farmer contributes, all four of them will benefit from an increase in their crop yields, so they will each gain $8.
Which of the following statements is correct?
- Do Not Contribute is a dominant strategy for all the farmers: whatever the others do, their own benefit from contributing is $8, but the cost is $10.
- In this case she will gain $16 from contributing, which is higher than the cost.
- Whatever Kim does, the dominant strategy for a selfish farmer is Do Not Contribute.
- If the farmers have an ongoing relationship they may all decide to contribute, to gain the future benefits of continued cooperation. If any of the neighbours failed to contribute in any year, cooperation would break down. Knowing this, they would have an incentive to contribute in the present.
4.7 Public good contributions and peer punishment
An experiment demonstrates that people can sustain high levels of cooperation in a public goods game, as long as they have opportunities to target free riders once it becomes clear who is contributing less than the norm.
Figure 4.9a shows the results of laboratory experiments that mimic the costs and benefits from contribution to a public good in the real world. The experiments were conducted in cities around the world. In each experiment participants play 10 rounds of a public goods game, similar to the one involving Kim and the other farmers that we just described. In each round, the people in the experiment (we call them subjects) are given $20. They are randomly sorted into small groups, typically of four people, who don’t know each other. They are asked to decide on a contribution from their $20 to a common pool of money. The pool is a public good. For every dollar contributed, each person in the group receives $0.40, including the contributor.
Imagine that you are playing the game, and you expect the other three members of your group each to contribute $10. Then if you don’t contribute, you will get $32 (three returns of $4 from their contributions, plus the initial $20 that you keep). The others have paid $10, so they only get $32 – $10 = $22 each. On the other hand, if you also contribute $10, then everyone, including you, will get $22 + $4 = $26. Unfortunately for the group, you do better by not contributing—that is, because the reward for free riding ($32) is greater than for contributing ($26). And, unfortunately for you, the same applies to each of the other members.
After each round, the participants are told the contributions of other members of their group. In Figure 4.9a, each line represents the evolution over time of average contributions in a different location around the world. Just as in the prisoners’ dilemma, people are definitely not solely self-interested.
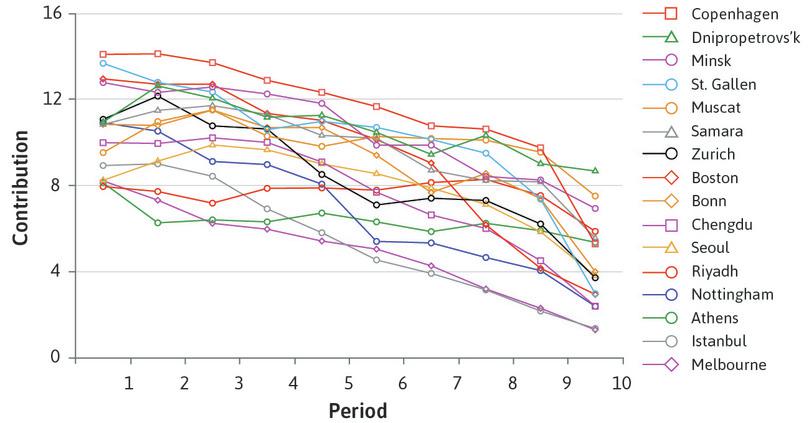
Worldwide public goods experiments: Contributions over 10 periods.
Worldwide public goods experiments: Contributions over 10 periods.
Figure 4.9a Worldwide public goods experiments: Contributions over 10 periods.
Benedikt Herrmann, Christian Thoni, and Simon Gachter. 2008. ‘Antisocial Punishment Across Societies’. Science 319 (5868): pp. 1362–67.
As you can see, players in Chengdu contributed $10 in the first round, just as we described above. In every population where the game was played, contributions to the public good were high in the first period, although much more so in some cities (Copenhagen) than in others (Melbourne). This is remarkable: if you care only about your own payoff, contributing nothing at all is the dominant strategy. The high initial contributions could have occurred because the participants in the experiment valued their contribution to the payoffs that others received (they were altruistic). But the difficulty (or, as Hardin would have described it, the tragedy) is obvious. Everywhere, the contributions to the public good decreased over time.
Nevertheless, the results also show that despite a large variation across societies, most of them still have high contribution levels at the end of the experiment.
The most plausible explanation of the pattern is not altruism. It is likely that contributors decreased their level of cooperation if they observed that others were contributing less than expected and were therefore free riding on them. It seems as if those people who contributed more than the average liked to punish the low contributors for their unfairness, or for violating a social norm of contributing. Since the payoffs of free riders depend on the total contribution to the public good, the only way to punish free riders in this experiment was to stop contributing. This is the tragedy of the commons.
Many people are happy to contribute as long as others reciprocate. A disappointed expectation of reciprocity is the most convincing reason that contributions fell so regularly in later rounds of this game.
To test this, the experimenters took the public goods game experiment shown in Figure 4.9a and introduced a punishment option. After observing the contributions of their group, individual players could pay to punish other players by making them pay a $3 fine. The punisher remained anonymous, but had to pay $1 per player punished. The effect is shown in Figure 4.9b. For the majority of subjects, including those in China, South Korea, northern Europe and the English-speaking countries, contributions increased when they had the opportunity to punish free riders.
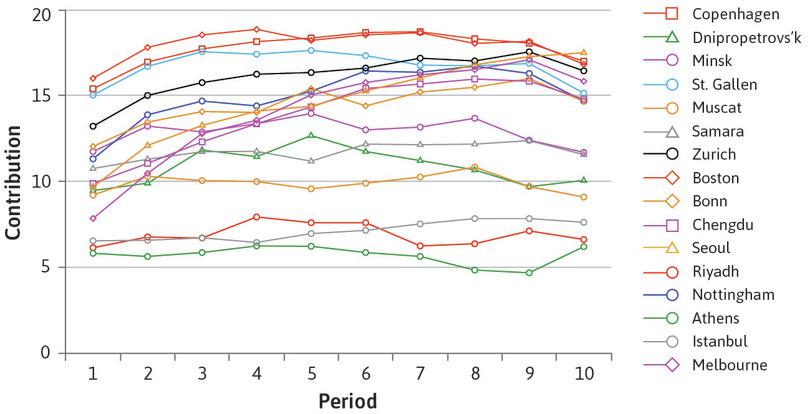
Worldwide public goods experiments with opportunities for peer punishment.
Worldwide public goods experiments with opportunities for peer punishment.
Figure 4.9b Worldwide public goods experiments with opportunities for peer punishment.
Benedikt Herrmann, Christian Thoni, and Simon Gachter. 2008. ‘Antisocial Punishment Across Societies’. Science 319 (5868): pp. 1362–67.
People who think that others have been unfair or have violated a social norm may retaliate, even if the cost to themselves is high. Their punishment of others is a form of altruism, because it costs them something to help deter free riding behaviour that is detrimental to the wellbeing of most members of the group.
This experiment illustrates the way that, even in large groups of people, a combination of repeated interactions and social preferences can support high levels of contribution to the public good.
The public goods game, like the prisoners’ dilemma, is a situation in which there is something to gain for everyone by engaging with others in a common project such as pest control, maintaining an irrigation system, or controlling carbon emissions. But there is also something to lose when others free ride.
4.8 Behavioural experiments in the lab and in the field
To understand economic behaviour, we need to know about people’s preferences. In the previous unit, for example, students and farmers valued free time. How much they valued it was part of the information we needed to predict how much time they spend studying and farming.
- revealed preference
- A way of studying preferences by reverse engineering the motives of an individual (her preferences) from observations about her or his actions.
In the past, economists have learned about our preferences from:
- Survey questions: To determine political preferences, brand loyalty, degree of trust of others, or religious orientation.
- Statistical studies of economic behaviour: For example, purchases of one or more goods when the relative price varies—to determine preferences for the goods in question. One strategy is to reverse-engineer what the preferences must have been, as revealed by purchases. This is called revealed preference.
Surveys have a problem. Asking someone if they like ice cream will probably get an honest answer. But the answer to the question: ‘How altruistic are you?’ may be a mixture of truth, self-advertising, and wishful thinking. Statistical studies cannot control the decision-making environment in which the preferences were revealed, so it is difficult to compare the choices of different groups.
This is why economists sometimes use experiments, so that people’s behaviour can be observed under controlled conditions.
How economists learn from facts Laboratory experiments
Behavioural experiments have become important in the empirical study of preferences.10 Part of the motivation for experiments is that understanding someone’s motivations (altruism, reciprocity, inequality aversion as well as self-interest) is essential to being able to predict how they will behave as employees, family members, custodians of the environment, and citizens.
Experiments measure what people do rather than what they say. Experiments are designed to be as realistic as possible, while controlling the situation:
- Decisions have consequences: The decisions in the experiment may decide how much money the subjects earn by taking part. Sometimes the stakes can be as high as a month’s income.
- Instructions, incentives and rules are common to all subjects: There is also a common treatment. This means that if we want to compare two groups, the only difference between the control and treatment groups is the treatment itself, so that its effects can be identified.
- Experiments can be replicated: They are designed to be implementable with other groups of participants.
- Experimenters attempt to control for other possible explanations: Other variables are kept constant wherever possible, because they may affect the behaviour we want to measure.
This means that when people behave differently in the experiment, it is likely due to differences in their preferences, not in the situation that each person faces.
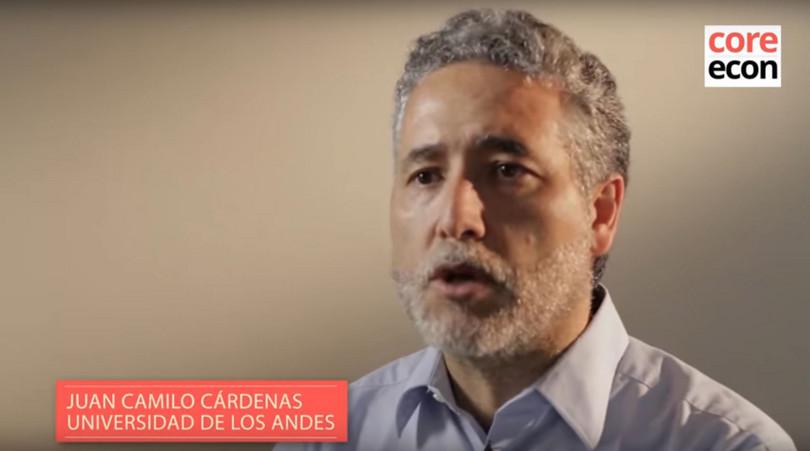
Economists have studied public goods extensively using laboratory experiments in which the subjects are asked to make decisions about how much to contribute to a public good. In some cases, economists have designed experiments that closely mimic real-world social dilemmas. The work of Juan Camilo Cárdenas, an economist at the Universidad de los Andes in Bogotá, Colombia is an example. He performs experiments about social dilemmas with people who are facing similar problems in their real life, such as overexploitation of a forest or a fish stock. In our ‘Economist in action’ video he describes his use of experimental economics in real-life situations, and how it helps us understand why people cooperate even when there are apparent incentives not to do so.
Economists have discovered that the way people behave in experiments can be used to predict how they react in real-life situations. For example, fishermen in Brazil who acted more cooperatively in an experimental game also practiced fishing in a more sustainable manner than the fishermen who were less cooperative in the experiment.
For a summary of the kinds of experiments that have been run, the main results, and whether behaviour in the experimental lab predicts real-life behaviour, read the research done by some of the economists who specialize in experimental economics. For example, Colin Camerer and Ernst Fehr,10 Armin Falk and James Heckman,11 or the experiments done by Joseph Heinrich and a large team of collaborators around the world.12
In Exercise 4.5, however, Stephen Levitt and John List ask whether people would behave the same way in the street as they do in the laboratory.
Question 4.7 Choose the correct answer(s)
According to the ‘Economist in action’ video of Juan Camilo Cárdenas, which of the following have economists discovered using experiments simulating public goods scenarios?
- This is one of the findings that Professor Cárdenas mentions.
- Professor Cárdenas finds that populations with greater inequality exhibit less trust and cooperation.
- Cooperative behaviour occurs even when experimental participants are offered real cash as in Professor Cárdenas’ experiments.
- This is one of the findings that Professor Cárdenas mentions.
Exercise 4.5 Are lab experiments always valid?
In 2007, Steven Levitt and John List published a paper called ‘What Do Laboratory Experiments Measuring Social Preferences Reveal about the Real World?’. Read the paper to answer these two questions.
- According to their paper,13 why and how might people’s behaviour in real life vary from what has been observed in laboratory experiments?
- Using the example of the public goods experiment in this section, explain why you might observe systematic differences between the observations recorded in Figures 4.9a and 4.9b, and what might happen in real life.
Sometimes it is possible to conduct experiments ‘in the field’: that is, to deliberately change the economic conditions under which people make decisions, and observe how their behaviour changes. An experiment conducted in Israel in 1998 demonstrated that social preferences may be very sensitive to the context in which decisions are made.
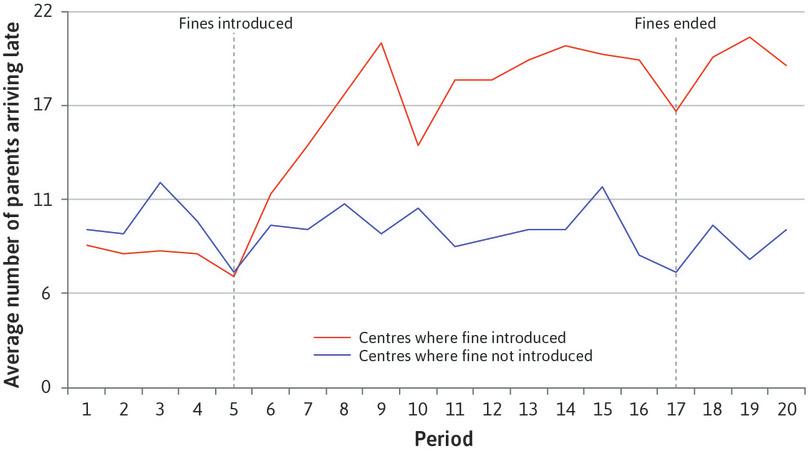
It is common for parents to rush to pick up their children from daycare. Sometimes a few parents are late, making teachers stay extra time. What would you do to deter parents from being late? Two economists ran an experiment introducing fines in some daycare centres but not others (these were used as controls). The ‘price of lateness’ went from zero to ten Israeli shekels (about $3 at the time). Surprisingly, after the fine was introduced, the frequency of late pickups doubled. The top line in Figure 4.10 illustrates this.
Average number of late-coming parents, per week.
Average number of late-coming parents, per week.
Figure 4.10 Average number of late-coming parents, per week.
Uri Gneezy and Aldo Rustichini. 2000. ‘A Fine Is a Price’. The Journal of Legal Studies 29 (January): pp. 1–17.
Why did putting a price on lateness backfire?
One possible explanation is that before the fine was introduced, most parents were on time because they felt that it was the right thing to do. In other words, they came on time because of a moral obligation to avoid inconveniencing the daycare staff. Perhaps they felt an altruistic concern for the staff, or regarded a timely pick-up as a reciprocal responsibility in the joint care of the child. But the imposition of the fine signalled that the situation was really more like shopping. Lateness had a price and so could be purchased, like vegetables or ice-cream.14
- crowding out
- There are two quite distinct uses of the term. One is the observed negative effect when economic incentives displace people’s ethical or other-regarding motivations. In studies of individual behaviour, incentives may have a crowding out effect on social preferences. A second use of the term is to refer to the effect of an increase in government spending in reducing private spending, as would be expected for example in an economy working at full capacity utilization, or when a fiscal expansion is associated with a rise in the interest rate.
The use of a market-like incentive—the price of lateness—had provided what psychologists call a new ‘frame’ for the decision, making it one in which self-interest rather than concern for others was acceptable. When fines and prices have these unintended effects, we say that incentives have crowded out social preferences. Even worse, you can also see from Figure 4.10 that when the fine was removed, parents continued to pick up their children late.
Question 4.8 Choose the correct answer(s)
Figure 4.10 depicts the average number of late-coming parents per week in day-care centres, where a fine was introduced in some centres and not in others. The fines were eventually abolished, as indicated on the graph.
Based on this information, which of the following statements is correct?
- The graph shows that the number of late-coming parents more than doubled in the centres where the fine was introduced.
- The parents paid the fine if they were late and not otherwise. So it can be considered as a price for lateness.
- The graph shows that the number of late-coming parents remained high after the fine was abolished, so it is possible that the experiment had a permanent effect.
- The crowding out of the social preference occurs when the moral obligation of not being late is replaced by the market-like incentive of purchasing the right to be late without ethical qualms. This is evident in the graph immediately after the introduction of the fines.
Exercise 4.6 Crowding out
Imagine you are the mayor of a small town and wish to motivate your citizens to get involved in ‘City Beautiful Day’, in which people spend one day to help cleaning parks and roads.
How would you design the day to motivate citizens to take part?
4.9 Cooperation, negotiation, conflicts of interest, and social norms
- cooperation
- Participating in a common project that is intended to produce mutual benefits.
Cooperation means participating in a common project in such a way that mutual benefits occur. Cooperation need not be based on an agreement. We have seen examples in which players acting independently can still achieve a cooperative outcome:
- The invisible hand: Anil and Bala chose their crops in pursuit of their own interests. Their engagement in the village market resulted in a mutually beneficial division of labour.
- The repeated prisoners’ dilemma: They may refrain from using Terminator for pest control because they recognize the future losses they would suffer as a result of abandoning IPC.
- The public goods game: Players’ willingness to punish others sustained high levels of cooperation in many countries, without the need for agreements.
In other cases, such as the one-shot prisoners’ dilemma, independent actions led to an unfortunate outcome. Then, the players could do better if they could reach an agreement.
People commonly resort to negotiation to solve their economic and social problems. For example, international negotiation resulted in the Montreal Protocol, through which countries agreed to eliminate the use of chlorofluorocarbons (CFCs), in order to avoid a harmful outcome (the destruction of the ozone layer).
But negotiation does not always succeed, sometimes because of conflicts of interest over how the mutual gains to cooperation will be shared. The success of the Montreal Protocol contrasts with the relative failure of the Kyoto Protocol in reducing carbon emissions responsible for global warming. The reasons are partly scientific. The alternative technologies to CFCs were well-developed and the benefits relative to costs for large industrial countries, such as the US, were much clearer and larger than in the case of greenhouse gas emissions. But one of the obstacles to agreement at the Copenhagen climate change summit in 2009 was over how to share the costs and benefits of limiting emissions between developed and developing countries.
As a simpler example of a conflict of interest, consider a professor who might be willing to hire a student as a research assistant for the summer. In principle, both have something to gain from the relationship, because this might also be a good opportunity for the student to earn some money and learn. In spite of the potential for mutual benefit, there is also some room for conflict. The professor may want to pay less and have more of his research grant left over to buy a new computer, or he may need the work to be done quickly, meaning the student can’t take time off. After negotiating, they may reach a compromise and agree that the student can earn a small salary while working from the beach. Or, perhaps, the negotiation will fail.
There are many situations like this in economics. A negotiation (sometimes called bargaining) is also an integral part of politics, foreign affairs, law, social life and even family dynamics. A parent may give a child a smartphone to play with in exchange for a quiet evening, a country might consider giving up land in exchange for peace, or a government might be willing to negotiate a deal with student protesters to avoid political instability. As with the student and the professor, each of these bargains might not actually happen if either side is not willing to do these things.
Negotiation: Sharing mutual gains
To help think about what makes a deal work, consider the following situation. You and a friend are walking down an empty street and you see a $100 note on the ground. How would you decide how to split your lucky find? If you split the amount equally, perhaps this reflects a social norm in your community that says that something you get by luck should be split 50–50.
Dividing something of value in equal shares (the 50–50 rule) is a social norm in many communities, as is giving gifts on birthdays to close family members and friends. Social norms are common to an entire group of people (almost all follow them) and tell a person what they should do in the eyes of most people in the community.
In economics we think of people as making decisions according to their preferences, by which we mean all of the likes, dislikes, attitudes, feelings, and beliefs that motivate them. So everyone’s preferences are individual. They may be influenced by social norms, but they reflect what people want to do as well as what they think they ought to do.
We would expect that, even if there were a 50–50 norm in a community, some individuals might not respect the norm exactly. Some people may act more selfishly than the norm requires and others more generously. What happens next will depend both on the social norm (a fact about the world, which reflects attitudes to fairness that have evolved over long periods), but also on the specific preferences of the individuals concerned.
- fairness
- A way to evaluate an allocation based on one’s conception of justice.
Suppose the person who saw the money first has picked it up. There are at least three reasons why that person might give some of it to a friend:
- Altruism: We have already considered this reason, in the case of Anil and Bala. This person might be altruistic and care about the other being happy, or about another aspect of the other’s wellbeing.
- Fairness: Or, the person holding the money might think that 50–50 is fair. In this case, the person is motivated by fairness, or what economists term inequality aversion.
- Reciprocity: The friend may have been kind to the lucky money-finder in the past, or kind to others, and deserves to be treated generously because of this. In this case we say that our money-finder has reciprocal preferences.
These social preferences all influence our behaviour, sometimes working in opposite directions. For example, if the money-finder has strong fairness preferences but knows that the friend is entirely selfish, the fairness preferences tempt the finder to share but the reciprocity preferences push the finder to keep the money.
Question 4.9 Choose the correct answer(s)
Anastasia and Belinda’s favourite hobby is to go metal detecting. On one occasion Anastasia finds four Roman coins while Belinda is unsuccessful. Both women have reciprocal preferences. From this, can we say that:
- It depends how altruistic Anastasia is. She could be altruistic but give only one coin to Belinda.
- Because Anastasia has reciprocal preferences, she may want to punish Belinda for having been selfish in the past. So even if she is altruistic, she may derive greater satisfaction from punishment than sharing.
- Reciprocity means that Anastasia may still share, if she has benefitted from Belinda’s altruism in the past or hopes to benefit from it in the future.
- Anastasia’s altruism and desire not to go against Belinda’s standard of fairness—so as to not incur punishment—may or may not be sufficient to encourage her to split the find 50–50.
4.10 Dividing a pie (or leaving it on the table)
One of the most common tools to study social preferences is a two-person one-shot game known as the ultimatum game. It has been used around the world with experimental subjects including students, farmers, warehouse workers, and hunter-gatherers. By observing their choices we investigate the subjects’ preferences and motives, such as pure self-interest, altruism, inequality aversion, or reciprocity.
The subjects of the experiment are invited to play a game in which they will win some money. How much they win will depend on how they and the others in the game play. Real money is at stake in experimental games like these, otherwise we could not be sure the subjects’ answers to a hypothetical question would reflect their actions in real life.
The rules of the game are explained to the players. They are randomly matched in pairs, then one player is randomly assigned as the Proposer, and the other the Responder. The subjects do not know each other, but they know the other player was recruited to the experiment in the same way. Subjects remain anonymous.
The Proposer is provisionally given an amount of money, say $100, by the experimenter, and instructed to offer the Responder part of it. Any split is permitted, including keeping it all, or giving it all away. We will call this amount the ‘pie’ because the point of the experiment is how it will be divided up.
The split takes the form: ‘x for me, y for you’ where x + y = $100. The Responder knows that the Proposer has $100 to split. After observing the offer, the Responder accepts or rejects it. If the offer is rejected, both individuals get nothing. If it is accepted, the split is implemented: the Proposer gets x and the Responder y. For example, if the Proposer offers $35 and the Responder accepts, the Proposer gets $65 and the Responder gets $35. If the Responder rejects the offer, they both get nothing.
This is called a take-it-or-leave-it offer. It is the ultimatum in the game’s name. The Responder is faced with a choice: accept $35, or get nothing.
- economic rent
- A payment or other benefit received above and beyond what the individual would have received in his or her next best alternative (or reservation option). See also: reservation option.
This is a game about sharing the economic rents that arise in an interaction. An entrepreneur wanting to introduce a new technology could share the rent—the higher profit than is available from the current technology—with employees if they cooperate in its introduction. Here, the rent arises because the experimenter provisionally gives the Proposer the pie to divide. If the negotiation succeeds (the Responder accepts), both players receive a rent (a slice of the pie); their next best alternative is to get nothing (the pie is thrown away).
In the example above, if the Responder accepts the Proposer’s offer, then the Proposer gets a rent of $65, and the Responder gets $35. For the Responder there is a cost to saying no. He loses the rent that he would have received. Therefore $35 is the opportunity cost of rejecting the offer.
We start by thinking about a simplified case of the ultimatum game, represented in Figure 4.11 in a diagram called a ‘game tree’. The Proposer’s choices are either the ‘fair offer’ of an equal split, or the ‘unfair offer’ of 20 (keeping 80 for herself). Then the respondent has the choice to accept or reject. The payoffs are shown in the last row.
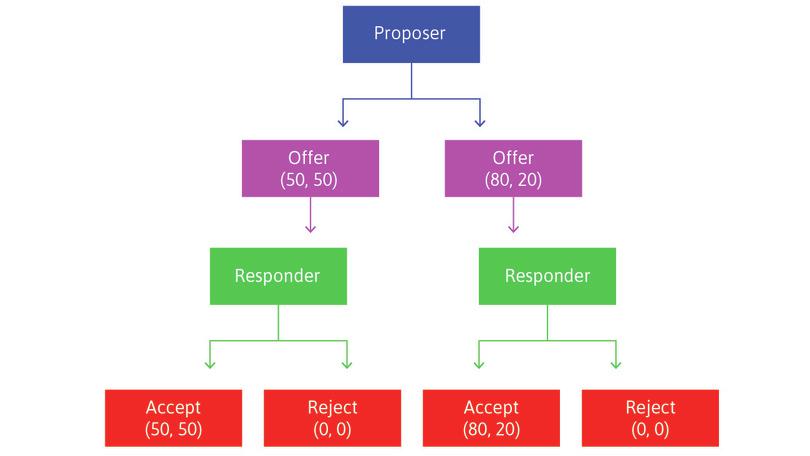
Game tree for the ultimatum game.
Game tree for the ultimatum game.
Figure 4.11 Game tree for the ultimatum game.
- sequential game
- A game in which all players do not choose their strategies at the same time, and players that choose later can see the strategies already chosen by the other players, for example the ultimatum game. See also: simultaneous game.
The game tree is a useful way to represent social interactions because it clarifies who does what, when they choose, and what are the results. We see that in the ultimatum game one player (the Proposer) chooses her strategy first, followed by the Responder. It is called a sequential game; previously we looked at simultaneous games, in which players chose strategies simultaneously.
- simultaneous game
- A game in which players choose strategies simultaneously, for example the prisoners’ dilemma. See also: sequential game.
What the Proposer will get depends on what the Responder does, so the Proposer has to think about the likely response of the other player. That is why this is called a strategic interaction. If you’re the Proposer you can’t try out a low offer to see what happens: you have only one chance to make an offer.
Put yourself in the place of the Responder in this game. Would you accept (50, 50)? Would you accept (80, 20)? Now switch roles. Suppose that you are the Proposer. What split would you offer to the Responder? Would your answer depend on whether the other person was a friend, a stranger, a person in need, or a competitor? A Responder who thinks that the Proposer’s offer has violated a social norm of fairness, or that the offer is insultingly low for some other reason, might be willing to sacrifice the payoff to punish the Proposer.
Now return to the general case, in which the Proposer can offer any amount between $0 and $100. If you were the Responder, what is the minimum amount you would be willing to accept? If you were the Proposer, what would you offer?
- minimum acceptable offer
- In the ultimatum game, the smallest offer by the Proposer that will not be rejected by the Responder. Generally applied in bargaining situations to mean the least favourable offer that would be accepted.
If you work through the Einstein below, and Exercise 4.7 that follows it, you will see how to work out the minimum acceptable offer, taking account of the social norm and of the individual’s own attitude to reciprocity. The minimal acceptable offer is the offer at which the pleasure of getting the money is equal to the satisfaction the person would get from refusing the offer and getting no money, but being able to punish the Proposer for violating the social norm of 50–50. If you are the Responder and your minimum acceptable offer is $35 (of the total pie of $100) then, if the Proposer offered you $36, you might not like the Proposer much, but you would still accept the offer instead of punishing the Proposer by rejecting the offer. If you rejected the offer, you would go home with satisfaction worth $35 and no money, when you could have had $36 in cash.
Einstein When will an offer in the ultimatum game be accepted?
Suppose $100 is to be split, and there is a fairness norm of 50–50. When the proposal is $50 or above, (y ≥ 50), the Responder feels positively disposed towards the Proposer and would naturally accept the proposal, as rejecting it would hurt both herself and the Proposer whom she appreciates because they conform to, or were even more generous than, the social norm. But if the offer is below $50 then she feels that the 50–50 norm is not being respected, and she may want to punish the Proposer for this breach. If she does reject the offer, this will come at a cost to her, because rejection means that both receive nothing.
Suppose the Responder’s anger at the breach of the social norm depends on the size of the breach: if the Proposer offers nothing she will be furious, but she’s more likely to be puzzled than angry at an offer of $49.50 rather than the $50 offer she might have expected based on the social norm. So how much satisfaction she would derive from punishing a Proposer’s low offer depends on two things: her private reciprocity motive (R), and the gain from accepting the offer (y). R is a number that indicates the strength of the Responder’s private reciprocity motive: if R is a large number, then she cares a lot about whether the Proposer is acting generously and fairly or not, but if R = 0 she does not care about the Proposer’s motives at all. So the satisfaction at rejecting a low offer is R(50 – y). The gain from accepting the offer is the offer itself, or y.
The decision to accept or reject just depends on which of these two quantities is larger. We can write this as ‘reject an offer if y < R(50 − y)’. This equation says that she will reject an offer of less than $50 according to how much lower than $50 the offer is (as measured by (50 − y)), multiplied by her private attitude to reciprocity (R).
To calculate her minimum acceptable offer we can rearrange this rejection equation like this:
R = 1 means that the Responder places equal importance on reciprocity and the social norm. When R = 1, then y < 25 and she will reject any offer less than $25. The cutoff point of $25 is where her two motivations of monetary gain and punishing the Proposer exactly balance out: if she rejects the offer of $25, she loses $25 but receives $25 worth of satisfaction from punishing the Proposer so her total payoff is $0.
The more the Responder cares about reciprocity, the higher the Proposer’s offers have to be. For example, if R = 0.5, the Responder will reject offers below $16.67 (y < 16.67), but if R = 2, then the Responder will reject any offer less than $33.33.
Exercise 4.7 Acceptable offers
- How might the minimum acceptable offer depend on the method by which the Proposer acquired the $100 (for example, did she find it on the street, win it in the lottery, receive it as an inheritance, and so on)?
- Suppose that the fairness norm in this society is 50–50. Can you imagine anyone offering more than 50% in such a society? If so, why?
4.11 Fair farmers, self-interested students?
If you are a Responder in the ultimatum game who cares only about your own payoffs, you should accept any positive offer because something, no matter how small, is always better than nothing. Therefore, in a world composed only of self-interested individuals, the Proposer would anticipate that the Responder would accept any offer and, for that reason, would offer the minimum possible amount—one cent—knowing it would be accepted.
Does this prediction match the experimental data? No, it does not. As in the prisoners’ dilemma, we don’t see the outcome we would predict if people were entirely self-interested. One-cent offers get rejected.
To see how farmers in Kenya and students in the US played this game, look at Figure 4.12. The height of each bar indicates the fraction of Responders who were willing to accept the offer indicated on the horizontal axis. Offers of more than half of the pie were acceptable to all of the subjects in both countries, as you would expect.
This is not always the case. In experiments in Papua New Guinea offers of more than half of the pie were commonly rejected by Responders who preferred to receive nothing than to participate in a very unequal outcome even if it was in the Responder’s favour, or to incur the social debt of having received a large gift that might be difficult to reciprocate. The subjects were inequity averse, even if the inequality in question benefited them.15
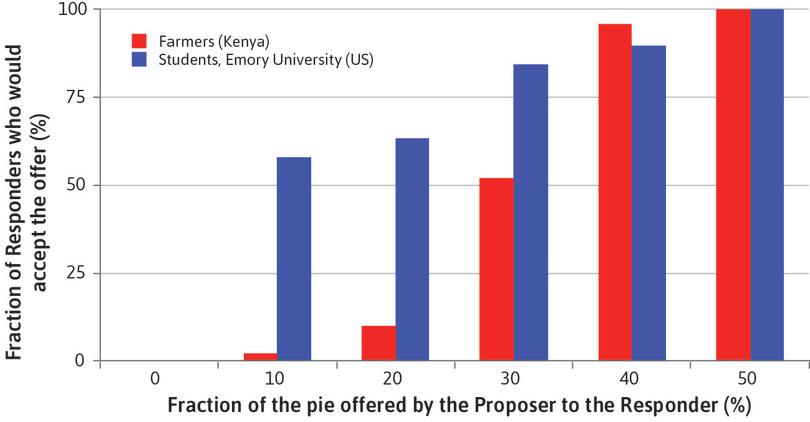
Acceptable offers in the ultimatum game.
Acceptable offers in the ultimatum game.
Figure 4.12 Acceptable offers in the ultimatum game.
Adapted from Joseph Henrich, Richard McElreath, Abigail Barr, Jean Ensminger, Clark Barrett, Alexander Bolyanatz, Juan Camilo Cardenas, Michael Gurven, Edwins Gwako, Natalie Henrich, Carolyn Lesorogol, Frank Marlowe, David Tracer, and John Ziker. 2006. ‘Costly Punishment Across Human Societies’. Science 312 (5781): pp. 1767–1770.
Notice that the Kenyan farmers are very unwilling to accept low offers, presumably regarding them as unfair, while the US students are much more willing to do so. For example, virtually all (90%) of the farmers would say no to an offer of one-fifth of the pie (the Proposer keeping 80%), while 63% of the students would accept such a low offer. More than half of the students would accept just 10% of the pie, but almost none of the farmers would.
Although the results in Figure 4.12 indicate that attitudes differ towards what is fair, and how important fairness is, nobody in the Kenyan and US experiments was willing to accept an offer of zero, even though by rejecting it they would also receive zero.
Exercise 4.8 Social preferences
Consider the experiment described in Figure 4.12:
- Which of the social preferences discussed above do you think motivated the subjects’ willingness to reject low offers, even though by doing so they would receive nothing at all?
- Why do you think that the results differed between the Kenyan farmers and the US students?
- What responses would you expect if you played this game with two different sets of players—your classmates and your family? Explain whether or not you expect the results to differ across these groups. If possible, play the game with your classmates and your family and comment on whether the results are consistent with your predictions.
The full height of each bar in Figure 4.13 indicates the percentage of the Kenyan and American Proposers who made the offer shown on the horizontal axis. For example, half of the farmers made proposals of 40%. Another 10% offered an even split. Only 11% of the students made such generous offers.
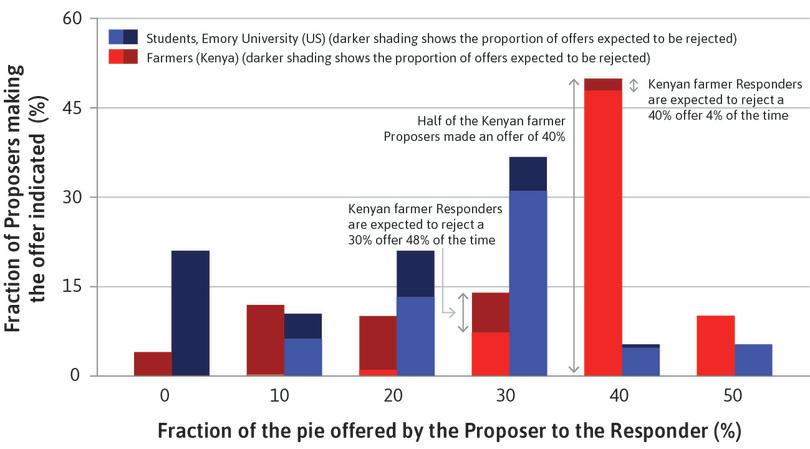
Actual offers and expected rejections in the ultimatum game.
Actual offers and expected rejections in the ultimatum game.
Figure 4.13 Actual offers and expected rejections in the ultimatum game.
Adapted from Joseph Henrich, Richard McElreath, Abigail Barr, Jean Ensminger, Clark Barrett, Alexander Bolyanatz, Juan Camilo Cardenas, Michael Gurven, Edwins Gwako, Natalie Henrich, Carolyn Lesorogol, Frank Marlowe, David Tracer, and John Ziker. 2006. ‘Costly Punishment Across Human Societies’. Science 312 (5781): pp. 1767–1770.
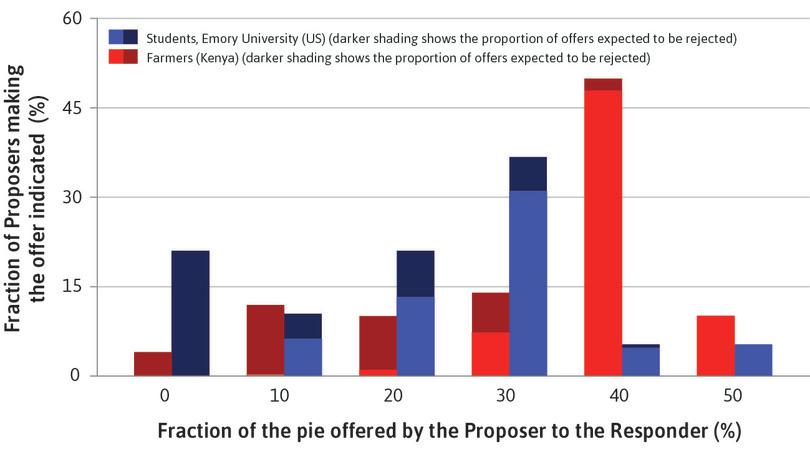
What do the bars show?
The full height of each bar in the figure indicates the percentage of the Kenyan and American Proposers who made the offer shown on the horizontal axis.
Figure 4.13b The full height of each bar in the figure indicates the percentage of the Kenyan and American Proposers who made the offer shown on the horizontal axis.
Adapted from Joseph Henrich, Richard McElreath, Abigail Barr, Jean Ensminger, Clark Barrett, Alexander Bolyanatz, Juan Camilo Cardenas, Michael Gurven, Edwins Gwako, Natalie Henrich, Carolyn Lesorogol, Frank Marlowe, David Tracer, and John Ziker. 2006. ‘Costly Punishment Across Human Societies’.. Science 312 (5781): pp. 1767–1770.
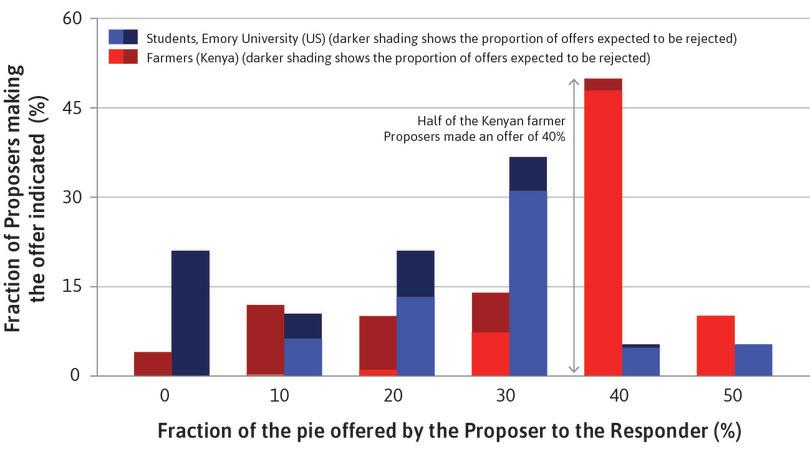
Reading the figure
For example: for Kenyan farmers, 50% on the vertical axis and 40% on the horizontal axis means half of the Kenyan Proposers made an offer of 40%.
Figure 4.13c For example: for Kenyan farmers, 50% on the vertical axis and 40% on the horizontal axis means half of the Kenyan Proposers made an offer of 40%.
Adapted from Joseph Henrich, Richard McElreath, Abigail Barr, Jean Ensminger, Clark Barrett, Alexander Bolyanatz, Juan Camilo Cardenas, Michael Gurven, Edwins Gwako, Natalie Henrich, Carolyn Lesorogol, Frank Marlowe, David Tracer, and John Ziker. 2006. ‘Costly Punishment Across Human Societies’.. Science 312 (5781): pp. 1767–1770.
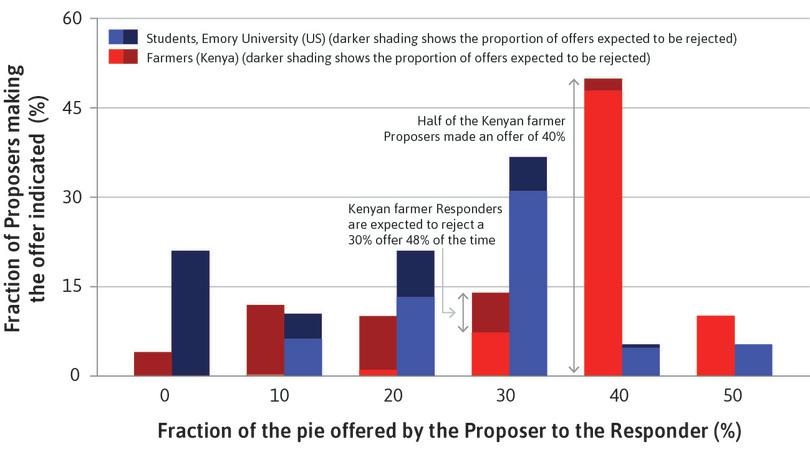
The dark-shaded area shows rejections
If Kenyan farmers made an offer of 30%, almost half of Responders would reject it. (The dark part of the bar is almost as big as the light part.)
Figure 4.13d If Kenyan farmers made an offer of 30%, almost half of Responders would reject it. (The dark part of the bar is almost as big as the light part.)
Adapted from Joseph Henrich, Richard McElreath, Abigail Barr, Jean Ensminger, Clark Barrett, Alexander Bolyanatz, Juan Camilo Cardenas, Michael Gurven, Edwins Gwako, Natalie Henrich, Carolyn Lesorogol, Frank Marlowe, David Tracer, and John Ziker. 2006. ‘Costly Punishment Across Human Societies’.. Science 312 (5781): pp. 1767–1770.
Better offers, fewer rejections
The relative size of the dark area is smaller for better offers: for example Kenyan farmer Responders rejected a 40% offer only 4% of the time.
Figure 4.13e The relative size of the dark area is smaller for better offers: for example Kenyan farmer Responders rejected a 40% offer only 4% of the time.
Adapted from Joseph Henrich, Richard McElreath, Abigail Barr, Jean Ensminger, Clark Barrett, Alexander Bolyanatz, Juan Camilo Cardenas, Michael Gurven, Edwins Gwako, Natalie Henrich, Carolyn Lesorogol, Frank Marlowe, David Tracer, and John Ziker. 2006. ‘Costly Punishment Across Human Societies’.. Science 312 (5781): pp. 1767–1770.
But were the farmers really generous? To answer, you have to think not only about how much they were offering, but also what they must have reasoned when considering whether the Respondent would accept the offer. If you look at Figure 4.13 and concentrate on the Kenyan farmers, you will see that very few proposed to keep the entire pie by offering zero (4% of them as shown in the far left-hand bar) and all of those offers would have been rejected (the entire bar is dark).
On the other hand, looking at the far right of the figure, we see that for the farmers, making an offer of half the pie ensured an acceptance rate of 100% (the entire bar is light). Those who offered 30% were about equally likely to see their offer rejected as accepted (the dark part of the bar is nearly as big as the light part).
A Proposer who wanted to earn as much as possible would choose something between the extreme of trying to take it all or dividing it equally. The farmers who offered 40% were very likely to see their offer accepted and receive 60% of the pie. In the experiment, half of the farmers chose an offer of 40%. We would expect the offer to be rejected only 4% of the time, as can be seen from the dark-shaded part of the bar at the 40% offer in Figure 4.13.
Now suppose you are a Kenyan farmer and all you care about is your own payoff.
Offering to give the Responder nothing is out of the question because that will ensure that you get nothing when they reject your offer. Offering half will get you half for sure—because the respondent will surely accept.
But you suspect that you can do better.
A Proposer who cares only about his own payoffs will compare what is called the expected payoffs of the two offers: that is, the payoff that one may expect, given what the other person is likely to do (accept or reject) in case this offer is made. Your expected payoff is the payoff you get if the offer is accepted, multiplied by the probability that it will be accepted (remember that if the offer is rejected, the Proposer gets nothing). Here is how the Proposer would calculate the expected payoffs of offering 40% or 30%:
We cannot know if the farmers actually made these calculations, of course. But if they did, they would have discovered that offering 40% maximized their expected payoff. This motivation contrasts with the case of the acceptable offers in which considerations of inequality aversion, reciprocity, or the desire to uphold a social norm were apparently at work. Unlike the Responders, many of the Proposers may have been trying to make as much money as possible in the experiment and had guessed correctly what the Responders would do.
Similar calculations indicate that, among the students, the expected payoff-maximizing offer was 30%, and this was the most common offer among them. The students’ lower offers could be because they correctly anticipated that lowball offers (even as low as 10%) would sometimes be accepted. They may have been trying to maximize their payoffs and hoping that they could get away with making low offers.
Exercise 4.9 Offers in the ultimatum game
- Why do you think that some of the farmers offered more than 40%? Why did some of the students offer more than 30%?
- Why did some offer less than 40% (farmers) and 30% (students)?
- Which of the social preferences that you have studied might help to explain the results shown?
How do the two populations differ? Although many of the farmers and the students offered an amount that would maximize their expected payoffs, the similarity ends there. The Kenyan farmers were more likely to reject low offers. Is this a difference between Kenyans and Americans, or between farmers and students? Or is it something related to local social norms, rather than nationality and occupation? Experiments alone cannot answer these interesting questions, but before you jump to the conclusion that Kenyans are more averse to unfairness than Americans, when the same experiment was run with rural Missourians in the US, they were even more likely to reject low offers than the Kenyan farmers. Almost every Missourian Proposer offered half the pie.
Question 4.10 Choose the correct answer(s)
Consider an ultimatum game where the Proposer offers a proportion of $100 to the Responder, who can either accept or reject the offer. If the Responder accepts, both the Proposer and the Responder keep the agreed share, while if the Responder rejects, then both receive nothing. Figure 4.12 shows the results of a study that compares the responses of US university students and Kenyan farmers.
From this information, we can conclude that:
- The Kenyan farmers in the experiment are more likely to reject low offers than the US students. This does not imply that all Kenyans are more likely to reject low offers than all Americans.
- Just over 50% of Kenyan farmers rejected the offer of the Responder receiving 30%.
- Both groups of Responders 100% rejected the offer of receiving nothing.
- The fact that Kenyan farmers were more likely to reject unfair offers and thus forgo any income indicates that they value fairness more.
Question 4.11 Choose the correct answer(s)
The following table shows the percentage of the Responders who rejected the amount offered by the Proposers in the ultimatum game played by Kenyan farmers and US university students. The pie is $100.
| Amount offered | $0 | $10 | $20 | $30 | $40 | $50 | |
|---|---|---|---|---|---|---|---|
| Proportion rejected | Kenyan farmers | 100% | 100% | 90% | 48% | 4% | 0% |
| US students | 100% | 40% | 35% | 15% | 10% | 0% |
From this information, we can say that:
- The expected payoff is an 85% chance of keeping $70 = 0.85 × 70 = $59.50.
- The expected payoff is a 90% chance of keeping $60 = 0.90 × 60 = $54.
- The expected payoff is a 10% chance of keeping $80 = 0.10 × 80 = $8.
- The probability of being rejected is higher for the Kenyan farmers than for the US students. The expected payoff is therefore lower for the farmers.
Exercise 4.10 Strikes and the ultimatum game
A strike over pay or working conditions may be considered an example of an ultimatum game.
- To model a strike as an ultimatum game, who is the Proposer and who is the Responder?
- Draw a game tree to represent the situation between these two parties.
- Research a well-known strike and explain how it satisfies the definition of an ultimatum game.
- In this section, you have been presented with experimental data on how people play the ultimatum game. How could you use this information to suggest what kind of situations might lead to a strike?
4.12 Competition in the ultimatum game
Ultimatum game experiments with two players suggest how people may choose to share the rent arising from an economic interaction. But the outcome of a negotiation may be different if it is affected by competition. For example, the professor looking for a research assistant could consider several applicants rather than just one.
Imagine a new version of the ultimatum game in which a Proposer offers a two-way split of $100 to two respondents, instead of just one. If either of the Responders accepts but not the other, that Responder and the Proposer get the split, and the other Responder gets nothing. If no one accepts, no one gets anything, including the Proposer. If both Responders accept, one is chosen at random to receive the split.
If you are one of the Responders, what is the minimum offer you would accept? Are your answers any different, compared to the original ultimatum game with a single Responder? Perhaps. If I knew that my fellow competitor is strongly driven by 50–50 split norms, my answer would not be too different. But what if I suspect that my competitor wants the reward very much, or does not care too much about how fair the offer is?
And now suppose you are the Proposer. What split would you offer?
Figure 4.14 shows some laboratory evidence for a large group of subjects playing multiple rounds. Proposers and Responders were randomly and anonymously matched in each round.
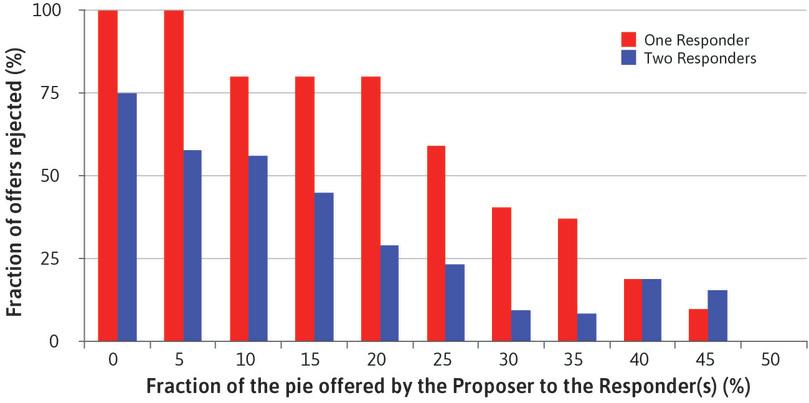
Fraction of offers rejected in the ultimatum game, according to offer size and the number of Responders.
Fraction of offers rejected in the ultimatum game, according to offer size and the number of Responders.
Figure 4.14 Fraction of offers rejected in the ultimatum game, according to offer size and the number of Responders.
Adapted from Figure 6 in Urs Fischbacher, Christina M. Fong, and Ernst Fehr. 2009. ‘Fairness, Errors and the Power of Competition’. Journal of Economic Behavior & Organization 72 (1): pp. 527–45.
The red bars show the fraction of offers that are rejected when there is a single Responder. The blue bars show what happens with two Responders. When there is competition, Responders are less likely to reject low offers. Their behaviour is more similar to what we would expect of self-interested individuals concerned mostly about their own monetary payoffs.
To explain this phenomenon to yourself, think about what happens when a Responder rejects a low offer. This means getting a zero payoff. Unlike the situation in which there is a sole Responder, the Responder in a competitive situation cannot be sure the Proposer will be punished, because the other Responder may accept the low offer (not everyone has the same norms about proposals, or is in the same state of need).
Consequently, even fair-minded people will accept low offers to avoid having the worst of both worlds. Of course, the Proposers also know this, so they will make lower offers, which Responders still accept. Notice how a small change in the rules or the situation can have a big effect on the outcome. As in the public goods game where the addition of an option to punish free riders greatly increased the levels of contribution, changes in the rules of the game matter.
Exercise 4.11 A sequential prisoners’ dilemma
Return to the prisoners’ dilemma pest control game that Anil and Bala played in Figure 4.3b, but now suppose that the game is played sequentially, like the ultimatum game. One player (chosen randomly) chooses a strategy first (the first mover), and then the second moves (the second mover).
- Suppose you are the first mover and you know that the second mover has strong reciprocal preferences, meaning the second mover will act kindly towards someone who upholds social norms not to pollute and will act unkindly to someone who violates the norm. What would you do?
- Suppose the reciprocal person is now the first mover interacting with the person she knows to be entirely self-interested. What do you think would be the outcome of the game?
4.13 Social interactions: Conflicts in the choice among Nash equilibria
In the invisible hand game, the prisoners’ dilemma, and the public goods game, the action that gave a player the highest payoffs did not depend on what the other player did. There was a dominant strategy for each player, and hence a single dominant strategy equilibrium.
But this is often not the case.
We have already mentioned a situation in which it is definitely untrue. Driving on the right or on the left. If others drive on the right, your best response is to drive on the right too. If they drive on the left, your best response is to drive on the left.
- Nash equilibrium
- A set of strategies, one for each player in the game, such that each player’s strategy is a best response to the strategies chosen by everyone else.
In the US, everyone driving on the right is an equilibrium, in the sense that no one would want to change their strategy given what others are doing. In game theory, if everyone is playing their best response to the strategies of everyone else, these strategies are termed a Nash equilibrium.
In Japan, though, Drive on the Left is a Nash equilibrium. The driving ‘game’ has two Nash equilibria.
Many economic interactions do not have dominant strategy equilibria, but if we can find a Nash equilibrium, it gives us a prediction of what we should observe. We should expect to see all players doing the best they can, given what others are doing.
But even in simple economic problems there may be more than one Nash equilibrium (as in the driving game). Suppose that when Bala and Anil choose their crops the payoffs are as shown in Figure 4.15. This is different from the invisible hand game. If the two farmers produce the same crop, there is now such a large fall in price that it is better for each to specialize, even in the crop they are less suited to grow. Follow the steps in Figure 4.15 to find the two equilibria.
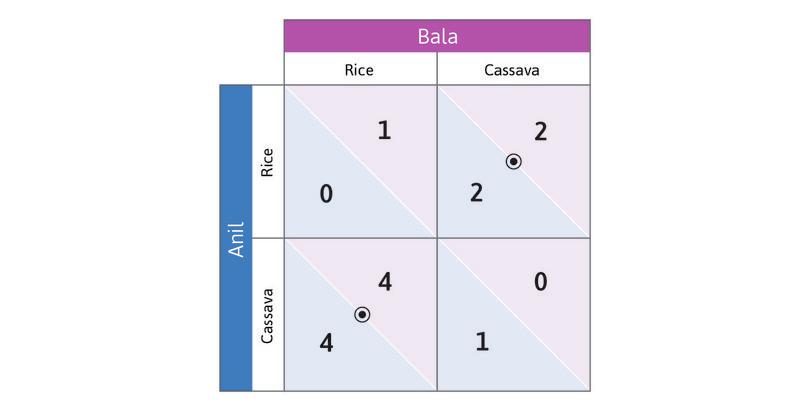
A division of labour problem with more than one Nash equilibrium.
A division of labour problem with more than one Nash equilibrium.
Figure 4.15 A division of labour problem with more than one Nash equilibrium.
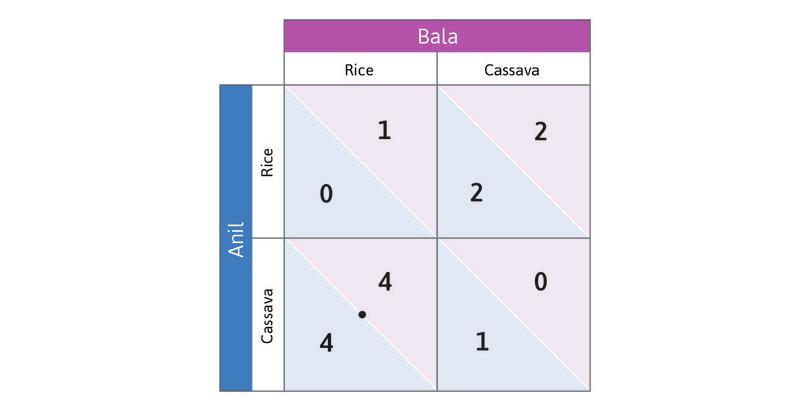
Anil’s best response to Rice
If Bala is going to choose Rice, Anil’s best response is to choose Cassava. We place a dot in the bottom left-hand cell.
Figure 4.15a If Bala is going to choose Rice, Anil’s best response is to choose Cassava. We place a dot in the bottom left-hand cell.
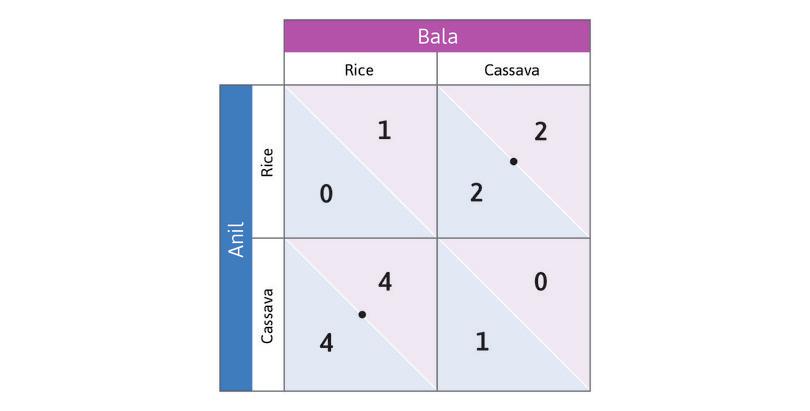
Anil’s best response to Cassava
If Bala is going to choose Cassava, Anil’s best response is to choose Rice. Place a dot in the top right-hand cell. Notice that Anil does not have a dominant strategy.
Figure 4.15b If Bala is going to choose Cassava, Anil’s best response is to choose Rice. Place a dot in the top right-hand cell. Notice that Anil does not have a dominant strategy.

Bala’s best responses
If Anil chooses Rice, Bala’s best response is to choose Cassava, and if Anil chooses Cassava he should choose Rice. The circles show Bala’s best responses. He doesn’t have a dominant strategy either.
Figure 4.15c If Anil chooses Rice, Bala’s best response is to choose Cassava, and if Anil chooses Cassava he should choose Rice. The circles show Bala’s best responses. He doesn’t have a dominant strategy either.

(Cassava, Rice) is a Nash equilibrium
If Anil chooses Cassava and Bala chooses Rice, both of them are playing best responses (a dot and a circle coincide). So this is a Nash equilibrium.
Figure 4.15d If Anil chooses Cassava and Bala chooses Rice, both of them are playing best responses (a dot and a circle coincide). So this is a Nash equilibrium.
(Rice, Cassava) is also a Nash equilibrium
If Anil chooses Rice and Bala chooses Cassava then both of them are playing best responses, so this is also a Nash equilibrium, but the payoffs are higher in the other equilibrium.
Figure 4.15e If Anil chooses Rice and Bala chooses Cassava then both of them are playing best responses, so this is also a Nash equilibrium, but the payoffs are higher in the other equilibrium.
Situations with two Nash equilibria prompt us to ask two questions:
- Which equilibrium would we expect to observe in the world?
- Is there a conflict of interest because one equilibrium is preferable to some players, but not to others?
Whether you drive on the right or the left is not a matter of conflict in itself, as long as everyone you are driving towards has made the same decision as you. We can’t say that driving on the left is better than driving on the right.
But in the division of labour game, it is clear that the Nash equilibrium with Anil choosing Cassava and Bala choosing Rice (where they specialize in the crop they produce best) is preferred to the other Nash equilibrium by both farmers.
Could we say, then, that we would expect to see Anil and Bala engaged in the ‘correct’ division of labour? Not necessarily. Remember, we are assuming that they take their decisions independently, without coordinating. Imagine that Bala’s father had been especially good at growing cassava (unlike his son) and so the land remained dedicated to cassava even though it was better suited to producing rice. In response to this, Anil knows that Rice is his best response to Bala’s Cassava, and so would have then chosen to grow rice. Bala would have no incentive to switch to what he is good at: growing rice.
The example makes an important point. If there is more than one Nash equilibrium, and if people choose their actions independently, then an economy can get ‘stuck’ in a Nash equilibrium in which all players are worse off than they would be at the other equilibrium.
Great economists John Nash
John Nash (1928–2015) completed his doctoral thesis at Princeton University at the age of 21. It was just 27 pages long, yet it advanced game theory (which was a little-known branch of mathematics back then) in ways that led to a dramatic transformation of economics. He provided an answer to the question: when people interact strategically, what would one expect them to do? His answer, now known as a Nash equilibrium, is a collection of strategies, one for each player, such that if these strategies were to be publicly revealed, no player would regret his or her own choice. That is, if all players choose strategies that are consistent with a Nash equilibrium, then nobody can gain by unilaterally switching to a different strategy.
Nash did much more than simply introduce the concept of an equilibrium, he proved that such an equilibrium exists under very general conditions, provided that players are allowed to randomize over their available set of strategies. To see the importance of this, consider the two-player children’s game rock-paper-scissors. If each of the players picks one of the three strategies with certainty, then at least one of the players would be sure to lose and would therefore have been better off choosing a different strategy. But if both players choose each available strategy with equal probability, then neither can do better by randomizing over strategies in a different way. This is accordingly a Nash equilibrium.
What Nash was able to prove is that any game with a finite number of players, each of whom has a finite number of strategies, must have at least one equilibrium, provided that players can randomize freely. This result is useful because strategies can be very complicated objects, specifying a complete plan that determines what action is to be taken in any situation that could possibly arise. The number of distinct strategies in chess, for instance, is greater than the number of atoms in the known universe. Yet we know that chess has a Nash equilibrium, although it remains unknown whether the equilibrium involves a win for white, a win for black, or a guaranteed draw.
What was remarkable about Nash’s existence proof is that some of the most distinguished mathematicians of the twentieth century, including Emile Borel and John von Neumann, had tackled the problem without getting very far. They were able to show the existence of equilibrium only for certain zero-sum games; those in which the gain for one player equals the loss to the others. This clearly limited the scope of their theory for economic applications. Nash allowed for a much more general class of games, where players could have any goals whatsoever. They could be selfish, altruistic, spiteful, or fair-minded, for instance.
There is hardly a field in economics that the development of game theory has not completely transformed, and this development would have been impossible without Nash’s equilibrium concept and existence proof. Remarkably, this was not Nash’s only path-breaking contribution to economics—he also made a brilliantly original contribution to the theory of bargaining. In addition, he made pioneering contributions to other areas of mathematics, for which he was awarded the prestigious Abel Prize.
Nash would go on to share the Nobel Prize for his work. Roger Myerson, an economist who also won the prize, described the Nash equilibrium as ‘one of the most important contributions in the history of economic thought.’
Nash originally wanted to be an electrical engineer like his father, and studied mathematics as an undergraduate at Carnegie Tech (now Carnegie-Mellon University). An elective course in International Economics stirred his interest in strategic interactions, which eventually led to his breakthrough.16
For much of his life Nash suffered from mental illness that required hospitalization. He experienced hallucinations caused by schizophrenia that began in 1959, though after what he described as ‘25 years of partially deluded thinking’ he continued his teaching and research at Princeton. The story of his insights and illness are told in the book (made into a film starring Russell Crowe) A Beautiful Mind.
Resolving conflict
A conflict of interest occurs if players in a game would prefer different Nash equilibria.
To see this, consider the case of Astrid and Bettina, two software engineers who are working on a project for which they will be paid. Their first decision is whether the code should be written in Java or C++ (imagine that either programming language is equally suitable, and that the project can be written partly in one language and partly in the other). They each have to choose one program or the other, but Astrid wants to write in Java because she is better at writing Java code. While this is a joint project with Bettina, her pay will be partly based on how many lines of code were written by her. Unfortunately Bettina prefers C++ for just the same reason. So the two strategies are called Java and C++.
Their interaction is described in Figure 4.16a, and their payoffs are in Figure 4.16b.
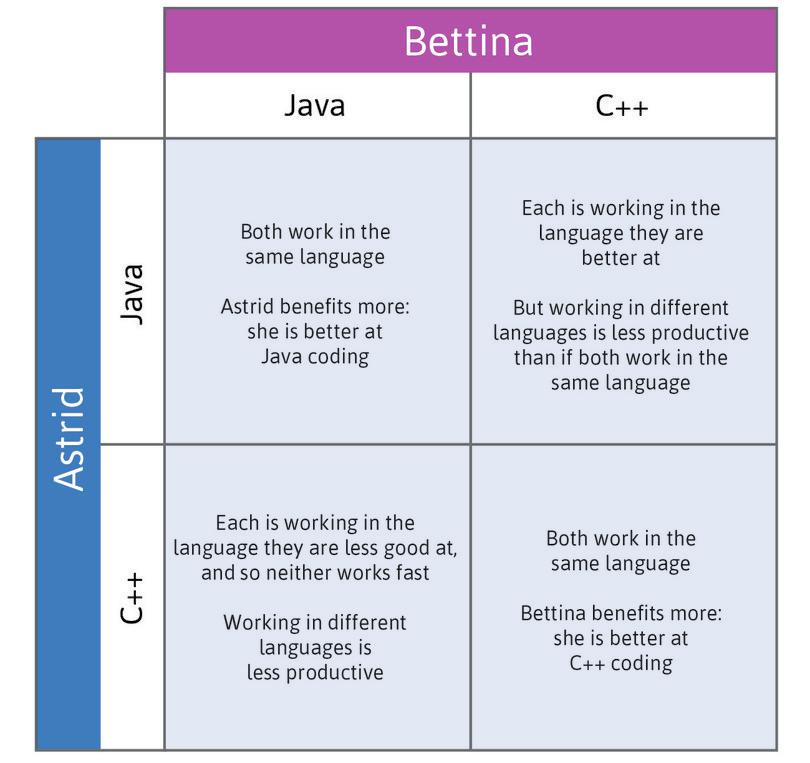
Interactions in the choice of programming language.
Interactions in the choice of programming language.
Figure 4.16a Interactions in the choice of programming language.
From Figure 4.16a, you can work out three things:
- They both do better if they work in the same language.
- Astrid does better if that language is Java, while the reverse is true for Bettina.
- Their total payoff is higher if they choose C++.
How would we predict the outcome of this game?

Payoffs (thousands of dollars to complete the project) according to the choice of programming language.
Payoffs (thousands of dollars to complete the project) according to the choice of programming language.
Figure 4.16b Payoffs (thousands of dollars to complete the project) according to the choice of programming language.
If you use the dot-and-circle method, you will find that each player’s best responses are to choose the same language as the other player. So there are two Nash equilibria. In one, both choose Java. In the other, both choose C++.
Can we say which of these two equilibria is more likely to occur? Astrid obviously prefers that they both play Java while Bettina prefers that they both play C++. With the information we have about how the two might interact, we can’t yet predict what would happen. Exercise 4.12 gives some examples of the type of information that would help to clarify what we would observe.
Exercise 4.12 Conflict between Astrid and Bettina
What is the likely result of the game in Figure 4.16b if:
- Astrid can choose which language she will use first, and commit to it (just as the Proposer in the ultimatum game commits to an offer, before the Responder responds)?
- The two can make an agreement, including which language they use, and how much cash can be transferred from one to the other?
- They have been working together for many years, and in the past they used Java on joint projects?
Exercise 4.13 Conflict in business
In the 1990s, Microsoft battled Netscape over market share for their web browsers, called Internet Explorer and Navigator. In the 2000s, Google and Yahoo fought over which company’s search engine would be more popular. In the entertainment industry, a battle called the ‘format wars’ played out between Blu-Ray and HD-DVD.
Use one of these examples to analyse whether there are multiple equilibria and, if so, why one equilibrium might emerge in preference to the others.
Question 4.12 Choose the correct answer(s)
This table shows the payoff matrix for a simultaneous one-shot game in which Anil and Bala choose their crops.

We can conclude that:
- In these two cases, both Anil and Bala are playing their best response to the other’s strategy. Therefore, these strategy pairs are Nash equilibria.
- When Bala chooses Cassava, Anil is better off choosing Rice. Hence Cassava is not a dominant strategy for Anil.
- When Anil chooses Rice, Bala is better off choosing Cassava. Hence Rice is not a dominant strategy for Bala.
- There are no dominant strategies. Hence there are no dominant strategy equilibria.
Exercise 4.14 Nash equilibria and climate change
Think of the problem of climate change as a game between two countries called China and the US, considered as if each were a single individual. Each country has two possible strategies for addressing global carbon emissions: Restrict (taking measures to reduce emissions, for example by taxing the use of fossil fuels) and BAU (the Stern report’s business as usual scenario). Figure 4.17 describes the outcomes (top) and hypothetical payoffs (bottom), on a scale from best, through good and bad, to worst. This is called an ordinal scale (because all that matters is the order: whether one outcome is better than the other, and not by how much it is better).
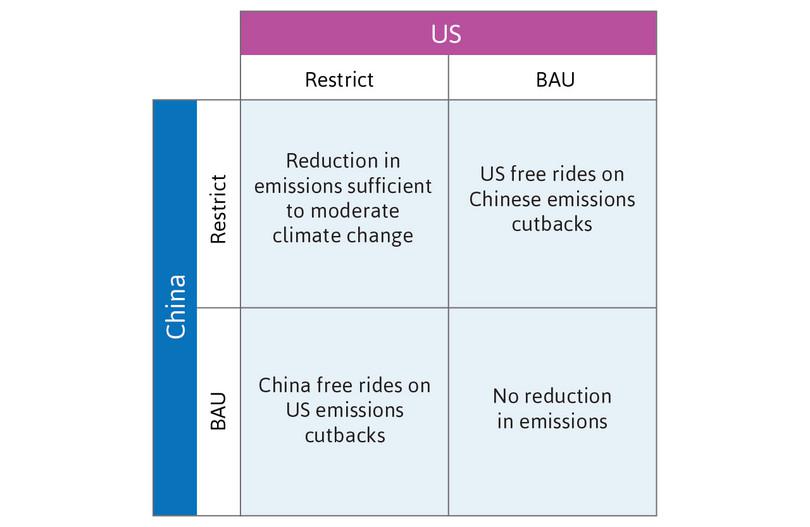
![Climate change policy as a prisoners’ dilemma (top). Payoffs for a climate change policy as a prisoners' dilemma (bottom left), and payoffs with inequality aversion and reciprocity (bottom right).]()
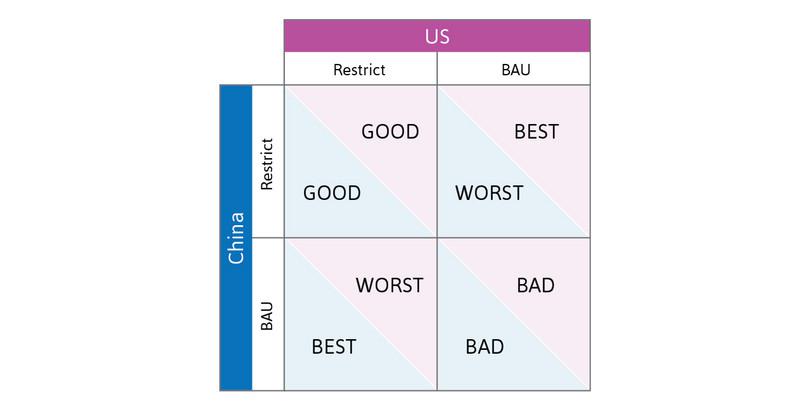
![Climate change policy as a prisoners’ dilemma (top). Payoffs for a climate change policy as a prisoners' dilemma (bottom left), and payoffs with inequality aversion and reciprocity (bottom right).]()

![Climate change policy as a prisoners’ dilemma (top). Payoffs for a climate change policy as a prisoners' dilemma (bottom left), and payoffs with inequality aversion and reciprocity (bottom right).]()
Climate change policy as a prisoners’ dilemma (top). Payoffs for a climate change policy as a prisoners’ dilemma (bottom left), and payoffs with inequality aversion and reciprocity (bottom right).
Figure 4.17 Climate change policy as a prisoners’ dilemma (top). Payoffs for a climate change policy as a prisoners’ dilemma (bottom left), and payoffs with inequality aversion and reciprocity (bottom right).
- Show that both countries have a dominant strategy. What is the dominant strategy equilibrium?
- The outcome would be better for both countries if they could negotiate a binding treaty to restrict emissions. Why might it be difficult to achieve this?
- Explain how the payoffs in the bottom right of Figure 4.17 could represent the situation if both countries were inequality averse and motivated by reciprocity. Show that there are two Nash equilibria. Would it be easier to negotiate a treaty in this case?
- Describe the changes in preferences or in some other aspect of the problem that would convert the game to one in which (like the invisible hand game) both countries choosing Restrict is a dominant strategy equilibrium.
4.14 Conclusion
We have used game theory to model social interactions. The invisible hand game illustrates how markets may channel individual self-interest to achieve mutual benefits, but the dominant strategy equilibrium of the prisoners’ dilemma game shows how individuals acting independently may be faced with a social dilemma.
Evidence suggests that individuals are not solely motivated by self-interest. Altruism, peer punishment, and negotiated agreements all contribute to the resolution of social dilemmas. There may be conflicts of interest over the sharing of the mutual gains from agreement, or because individuals prefer different equilibria, but social preferences and norms such as fairness can facilitate agreement.
Concepts introduced in Unit 4
Before you move on, review these definitions:
4.15 References
- Aesop. ‘Belling the Cat’. In Fables, retold by Joseph Jacobs. XVII, (1). The Harvard Classics. New York: P. F. Collier & Son, 1909–14; Bartleby.com, 2001.
- Bowles, Samuel. 2016. The Moral Economy: Why Good Incentives Are No Substitute for Good Citizens. New Haven, CT: Yale University Press.
- Camerer, Colin, and Ernst Fehr. 2004. ‘Measuring Social Norms and Preferences Using Experimental Games: A Guide for Social Scientists’. In Foundations of Human Sociality: Economic Experiments and Ethnographic Evidence from Fifteen Small-Scale Societies, eds. Joseph Henrich, Robert Boyd, Samuel Bowles, Colin Camerer, and Herbert Gintis. Oxford: Oxford University Press.
- Edgeworth, Francis Ysidro. 2003. Mathematical Psychics and Further Papers on Political Economy. Oxford: Oxford University Press.
- Falk, Armin, and James J. Heckman. 2009. ‘Lab Experiments Are a Major Source of Knowledge in the Social Sciences’. Science 326 (5952): pp. 535–538.
- Hardin, Garrett. 1968. ‘The Tragedy of the Commons’. Science 162 (3859): pp. 1243–1248.
- Henrich, Joseph, Richard McElreath, Abigail Barr, Jean Ensminger, Clark Barrett, Alexander Bolyanatz, Juan Camilo Cardenas, Michael Gurven, Edwins Gwako, Natalie Henrich, Carolyn Lesorogol, Frank Marlowe, David Tracer, and John Ziker. 2006. ‘Costly Punishment Across Human Societies’. Science 312 (5781): pp. 1767–1770.
- Henrich, Joseph, Robert Boyd, Samuel Bowles, Colin Camerer, and Herbert Gintis (editors). 2004. Foundations of Human Sociality: Economic Experiments and Ethnographic Evidence from Fifteen Small-Scale Societies. Oxford: Oxford University Press.
- IPCC. 2014. ‘Climate Change 2014: Synthesis Report’. Contribution of Working Groups I, II and III to the Fifth Assessment Report of the Intergovernmental Panel on Climate Change. Geneva, Switzerland: IPCC.
- Levitt, Steven D., and John A. List. 2007. ‘What Do Laboratory Experiments Measuring Social Preferences Reveal About the Real World?’. Journal of Economic Perspectives 21 (2): pp. 153–174.
- Mencken, H. L. 2006. A Little Book in C Major. New York, NY: Kessinger Publishing.
- Nasar, Sylvia. 2011. A Beautiful Mind: The Life of Mathematical Genius and Novel Laureate John Nash. New York, NY: Simon & Schuster.
- Ostrom, Elinor. 2000. ‘Collective Action and the Evolution of Social Norms’. Journal of Economic Perspectives 14 (3): pp. 137–58.
- Ostrom, Elinor. 2008. ‘The Challenge of Common-Pool Resources’. Environment: Science and Policy for Sustainable Development 50 (4): pp. 8–21.
- Ostrom, Elinor, James Walker, and Roy Gardner. 1992. ‘Covenants With and Without a Sword: Self-Governance is Possible’. The American Political Science Review 86 (2).
- Stern, Nicholas. 2007. The Economics of Climate Change: The Stern Review. Cambridge: Cambridge University Press.
-
Nicholas Stern. 2007. The Economics of Climate Change: The Stern Review. Cambridge: Cambridge University Press. Read the executive summary. ↩
-
IPCC. 2014. ‘Climate Change 2014: Synthesis Report’. Contribution of Working Groups I, II and III to the Fifth Assessment Report of the Intergovernmental Panel on Climate Change. Geneva, Switzerland: IPCC. ↩
-
Garrett Hardin. 1968. ‘The Tragedy of the Commons’. Science 162 (3859): pp. 1243–1248. ↩
-
Elinor Ostrom. 2008. ‘The Challenge of Common-Pool Resources’. Environment: Science and Policy for Sustainable Development 50 (4): pp. 8–21. ↩
-
Aesop. ‘Belling the Cat’. In Fables, retold by Joseph Jacobs. XVII, (1). The Harvard Classics. New York: P. F. Collier & Son, 1909–14; Bartleby.com, 2001. ↩
-
Francis Ysidro Edgeworth. 2003. Mathematical Psychics and Further Papers on Political Economy. Oxford: Oxford University Press. ↩
-
H. L. Mencken. 2006. A Little Book in C Major. New York, NY: Kessinger Publishing. ↩
-
Elinor Ostrom. 2000. ‘Collective Action and the Evolution of Social Norms’. Journal of Economic Perspectives 14 (3): pp. 137–58. ↩
-
Elinor Ostrom, James Walker, and Roy Gardner. 1992. ‘Covenants With and Without a Sword: Self-Governance is Possible’. The American Political Science Review 86 (2). ↩
-
Colin Camerer and Ernst Fehr. 2004. ‘Measuring Social Norms and Preferences Using Experimental Games: A Guide for Social Scientists’. In Foundations of Human Sociality: Economic Experiments and Ethnographic Evidence from Fifteen Small-Scale Societies, edited by Joseph Henrich, Robert Boyd, Samuel Bowles, Colin Camerer, and Herbert Gintis, Oxford: Oxford University Press. ↩ ↩2
-
Armin Falk and James J. Heckman. 2009. ‘Lab Experiments Are a Major Source of Knowledge in the Social Sciences’. Science 326 (5952): pp. 535–538. ↩
-
Joseph Henrich, Richard McElreath, Abigail Barr, Jean Ensminger, Clark Barrett, Alexander Bolyanatz, Juan Camilo Cardenas, Michael Gurven, Edwins Gwako, Natalie Henrich, Carolyn Lesorogol, Frank Marlowe, David Tracer, and John Ziker. 2006. ‘Costly Punishment Across Human Societies’. Science 312 (5781): pp. 1767–1770. ↩
-
Steven D. Levitt, and John A. List. 2007. ‘What Do Laboratory Experiments Measuring Social Preferences Reveal About the Real World?’ Journal of Economic Perspectives 21 (2): pp. 153–174. ↩
-
Samuel Bowles. 2016. The Moral Economy: Why Good Incentives Are No Substitute for Good Citizens. New Haven, CT: Yale University Press. ↩
-
Joseph Henrich, Robert Boyd, Samuel Bowles, Colin Camerer, and Herbert Gintis (editors). 2004. Foundations of Human Sociality: Economic Experiments and Ethnographic Evidence from Fifteen Small-Scale Societies. Oxford: Oxford University Press. ↩
-
Sylvia Nasar. 2011. A Beautiful Mind: The Life of Mathematical Genius and Nobel Laureate John Nash. New York, NY: Simon & Schuster. ↩
