Unit 22 Economics, politics, and public policy
As an economic actor, a democratic government in a capitalist economy can promote improved living standards, with gains fairly shared. Often, though, this does not happen
- In this unit, we look at how institutions and policies are chosen. Why are some institutions and policies adopted, and not others?
- Like firms and families, the government of a nation is an important economic actor whose actions can be understood by studying the preferences of government leaders, and the constraints under which they operate.
- A government is distinct from other actors in society in that it can require citizens to abide by its decisions, using force if necessary (for example, police powers).
- Governments also have obligations that they owe to their citizens as a matter of right. As a result, they use tax funds to provide goods and services (such as police protection or basic schooling), which are usually free of charge.
- Ideally, democracy empowers citizens by extending voting rights in competitive elections to everyone, and limits what governments can do by ensuring individual rights of speech and association.
- Ideally, governments should adopt policies to ensure that possibilities for mutual gains (for example through exchange) are realized, and that economic outcomes are fair.
- Even in a democracy, inefficient or unfair economic outcomes occur because there are limits to what public policy can accomplish. Even when public policies are economically feasible, they may still not be implemented because powerful groups oppose them, or governments do not have the capacity to implement them.
The year that he became deputy president of South Africa, Cyril Ramaphosa was ranked the 29th-richest person in Africa. During his twenties and thirties Ramaphosa was a militant trade unionist who became general secretary of the National Union of Mineworkers and was deeply involved in the anti-apartheid movement. He probably did not anticipate that by 2012 he would be worth more than $700 million.
Born in 1952 in Soweto, then a poor black township outside Johannesburg, Ramaphosa grew up during the apartheid system of racial segregation. Because he was black, he was excluded from the best schools, healthcare, and even public bathrooms. Like others in the majority black population, he had no right to vote. The per capita income of black African families in the late 1980s was around 11% of that of white families. It had been stuck at this level for at least 50 years.
Resistance to the apartheid regime, together with the international support it generated, was one of the major social movements of the late twentieth century. But within South Africa it was brutally repressed from the beginning. In 1960, police fired on protesters against apartheid at Sharpeville. Sixty-nine unarmed people died. The African National Congress (ANC) was banned. Four years later Nelson Mandela, one of the leaders of the ANC, was imprisoned for life.
Ramaphosa was part of the next generation of anti-apartheid activists. As general secretary of the National Union of Mineworkers he was part of a wave of strikes and community protests in the mid- and late 1980s that convinced many white business owners that apartheid had to go. Eventually the government conceded defeat, releasing Mandela from prison.
Figure 22.1 shows how the size of the South African public old age pension received by different groups changed over the last 50 years. It tells a dramatic story of apartheid and its demise. Under apartheid, the government awarded different pensions to each of the ‘racial’ groups making up the population. In 1975, for example, the pension received by a white person was more than seven times that received by a black African person. The gradual equalization of the pension was dramatically achieved at the beginning of 1993 even before the first democratic election, with the abolition of all race-based distinctions in pension policy.
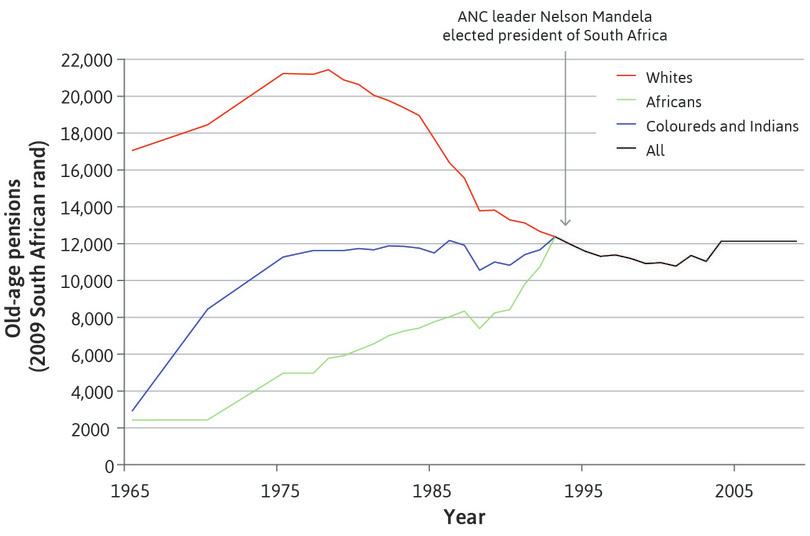
Apartheid and its demise: The value of South Africa’s old age pension.
Figure 22.1 Apartheid and its demise: The value of South Africa’s old age pension.
Murray Leibbrandt, Ingrid Woolard, Arden Finn, and Jonathan Argent. 2010. ‘Trends in South African Income Distribution and Poverty since the Fall of Apartheid’, OECD Social, Employment and Migration Working Papers, No. 101, OECD Publishing, Paris. Note: The names of the population groups are the official South African census terms. ‘Coloured’ is the South African term meaning people of mixed European, Asian and African origin.
In 1994, South Africa’s first democratic election made Mandela president. Ramaphosa was elected to parliament.
The transition to a democratic political system led to economic gains for the black population. For the first time, black workers were able to work in skilled jobs, which raised their wages. Schooling and healthcare were desegregated. Piped water and electricity became available to many more families.
But the transition to democratic rule did not narrow the gap between rich and poor. The Gini coefficient for income stood at 0.66 the year before the first democratic election, the highest of any major country in the world at the time. Fifteen years later (in 2008), it had risen to 0.70.1
Though by most measures economic disparities between the major population groups had declined, inequalities within the groups dramatically increased. This was especially true among black Africans, with a new class of the very rich pulling away from the rest.
- democracy
- A political system, that ideally gives equal political power to all citizens, defined by individual rights such as freedom of speech, assembly, and the press; fair elections in which virtually all adults are eligible to vote; and in which the government leaves office if it loses.
Cyril Ramaphosa’s life story, and South Africa’s recent history, show some of the many ways that political power affects the economy and how the economy shapes political power. The economic inequality between blacks and whites was a consequence of political institutions that prevented black South Africans from voting and restricted their political activities. These undemocratic measures united the opposition to apartheid from trade unions, neighbourhood organizations and students, the ANC, and other opposition parties, and finally brought democracy to South Africa. Yet after more than 20 years of democracy, no party other than the ANC has governed the country, and South Africa remains one of the world’s most unequal countries. The arrival of democracy, the abolition of apartheid, and the change in distribution of political power, did not lead to the reduction in inequality that might have been expected.
The government and the public policies it adopts have played a role in every unit in The Economy. But until now we have not asked why some policies are adopted and some are not, and how these policies change as the distribution of power changes, as it did so dramatically in South Africa over Cyril Ramaphosa’s lifetime.
This unit will first consider the nature of the government as an economic actor: what the government wants, how it achieves its goals, and how its actions are constrained. We will then consider democratic institutions in more depth. We will develop a model for how parties in a democracy choose their policies, and consider how differences between democratic institutions can affect political outcomes. Finally, we will explain how economic, administrative, and political barriers can prevent efficient and fair policies, even in highly democratic countries.
22.1 The government as an economic actor
A government allows people to do things together that they could not do individually, notably going to war. But governments also engage in activities that vastly improve living standards and the quality of life for their citizens. Examples include:2
- Poverty: Fifty years ago, even in rich countries, many retired or elderly people were trapped in poverty. For example, in 1966, 28.5% of US citizens aged 65 and over were classed as ‘poor’. Government transfers in many countries have virtually eliminated serious economic deprivation among the elderly. In 2012 just 9.1% of elderly people in the US were poor.
- Economic security: The increased size of government spending, as well as the policy lessons from the Great Depression and the golden age of capitalism, have reduced economic insecurity by making the business cycle less volatile.
- Increased life expectancy and the dramatic reduction in child mortality in many countries: When these occurred in the late nineteenth and early twentieth century, they were not primarily the result of advances in medicine, most of which came later. They followed government policies that improved sanitation and water supply.
Like firms and families, the government is an economic actor. Its taxes, spending, laws, wars, and other activities are as much a part of economic life as the investment, savings, buying, and selling activities of families and firms.
Coercion and providing public services
The government is an actor that dwarfs families and most firms. The US government, federal and local, employs almost 10 times as many people as the country’s largest firm, Walmart. However, governments were not always economic actors on this large a scale. In Figure 22.2 we show the total tax revenues collected by the government of the UK as a fraction of gross domestic product—a measure of the size of the government relative to the size of the economy—over more than 500 years. The figure rises from about 3% in the period prior to 1650 to 10 times that amount after the Second World War.3 4
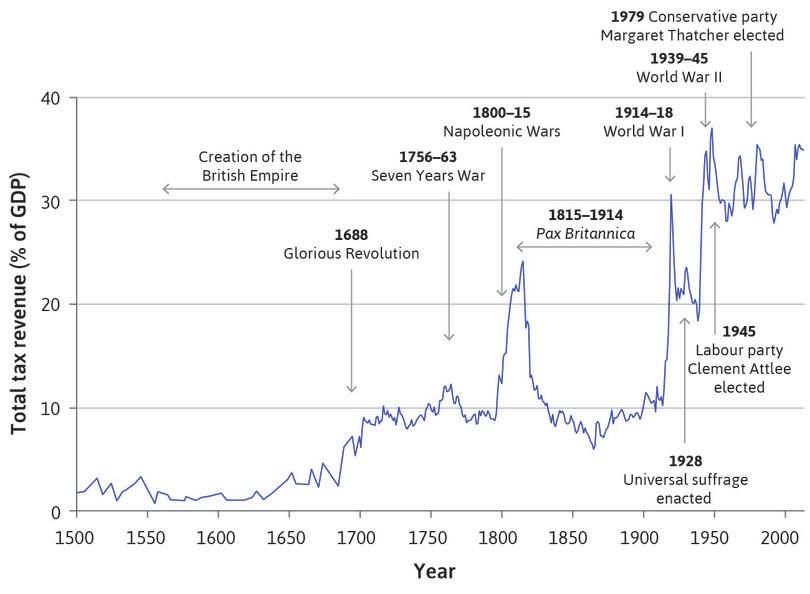
The growth of government in the UK (1500–2015).
Figure 22.2 The growth of government in the UK (1500–2015).
UK Public Revenue; Patrick K. O’Brien and Philip A. Hunt. 1993. ‘The rise of a fiscal state in England, 1485-1815’. Historical Research 66 (160): pp.129–76. Note: Pax Britannica refers to the century between the end of the Napoleonic Wars and the beginning of the First World War, in which (compared to earlier or subsequent periods) Europe and most of the world was relatively peaceful, with the UK the militarily dominant nation. The Glorious Revolution deposed King James II in 1688 and increased the independent power of parliament.
Not only is the government a much bigger economic actor than any family or firm, it is also unique among actors in any society. Within a given territory, it can dictate what people must do or not do and can use force and restraints on an individual’s freedom to achieve that end. Because citizens generally see the use of the government’s coercive powers to maintain order, regulate the economy and deliver services as legitimate—meaning that they accept the government’s authority—most citizens comply with government-made laws. One application of government’s coercive power is the collection of taxes, which can be used to fund government operations.
- government
- Within a given territory, the only body that can dictate what people must do or not do, and can legitimately use force and restraints on an individual’s freedom to achieve that end. Also known as: state.
To distinguish governments from private economic actors like firms, families, individuals, trade unions, and professional organizations, we define the government as the only body in a geographical territory (the nation) that can legitimately use force and the threat of force on citizens of that nation. Governments routinely do things—locking people up, for example—which, if done by a private individual, would be considered wrong.
To see why the government’s monopoly on the use of force is important, return to Bruno and Angela, whom you met in Unit 5.
Initially, Bruno was heavily armed and Angela was at his mercy. Bruno was not a government official. He was acting only as a private citizen. He used the threat of force to control the labour of others and to enjoy the fruits of their labour. As an economic actor, the only constraint Bruno faced was biological. He could not force Angela to work under conditions that would result in her death, not because that would have been murder, but because it would have deprived Bruno of ‘his’ worker.
Then we introduced a government that imposed laws on both Angela and Bruno, disarming Bruno. If he wanted Angela to work for him, he now had to make her an offer that she would accept without threat of harm from him. The government, in other words, came to monopolize the use of force. It used its force to protect Bruno’s private ownership of the land, which is why Angela could not simply farm the land herself, keeping all of the crops that she produced.
In the next stage of the story, the government became democratic, and as there were many more ‘Angelas’ than ‘Brunos’ in the population, Angela improved her economic position.
Beyond its legitimate use of coercive powers, a second feature of the government, one that also distinguishes it from firms and other private economic entities, is that it has obligations to its citizens based on civil and human rights. To advance and protect these rights, governments use tax funds to provide services such as national defence, police protection, and schooling. These services are often provided without restrictions to those who use them, and without charging a price.
People differ greatly in their income and wealth, and therefore in the taxes they pay, but because they are citizens, they are equally entitled to many of the services of the government. This is the cause of many debates about the appropriate ‘size’ of the government: people with less income and wealth benefit from many government services but, as we saw in Unit 19, people with more wealth and income pay more (in absolute terms) of the taxes that finance these services.
The tax, transfer, and expenditure systems of democratic governments typically redistribute income from those with higher to those with lower incomes, as shown in Figure 5.16 for a large sample of countries, and in more detail for the case of Mexico in Figure 19.29a. At the same time, ecologically and socially damaging practices are often used by those with higher incomes to increase their income further, at the expense of the poor.
Part of the solution
Jean Tirole, an economist who specializes in the role of intervention and regulation, describes the way that governments can intervene in his Nobel prize lecture.
In Figures 12.8 and 12.9, we looked at a variety of decisions made by private actors in the economy that affect others by imposing an uncompensated external cost or benefit. We also examined possible remedies for these market failures, often through government intervention. We also saw that governments adopt policies to correct the unfairness that sometimes results from private economic interactions. Governments may adopt the twin objectives that we have used in this course:
- ensuring that the mutual gains possible through our economic interactions are as large as possible and are fully realized
- sharing these gains in a fair manner
Examples of policies to address market failures and unfairness include:
- Competition policies: To reduce the price-setting powers of monopolies.
- Environmental policies: To reduce emissions of pollutants.
- Subsidies: For R&D.
- Policies that establish the expectation that aggregate demand will be relatively stable: So that firms will invest.
- Public provision of healthcare or compulsory insurance.
- Providing information: To allow people to make better decisions, such as the risks associated with financial products, children’s toys, and foods.
- Central bank policies: That require commercial banks to minimize their risk exposure by restricting the leverage of their balance sheets.
- Minimum wage laws: That prohibit contracts that pay below a stated minimum.
Governments pursue these objectives by some combination of four means:
- Incentives: Taxes, subsidies, and other expenditures alter the costs and benefits of activities that have external effects, which would lead to market failures or unfair outcomes if left unaccounted for.
- Regulation: Direct regulation of economic activities such as the degree of competition, including mandatory universal participation in social and medical insurance, and regulation of aggregate demand.
- Persuasion or information: Altering available information and people’s expectations about what others will do (for example, their belief that their property is secure or that other firms will invest) so as to allow people to coordinate their actions in a desirable way.
- Public provision: In-kind provision or through monetary transfers, including merit goods such as basic education, legal representation in court proceedings, and income transfers to alter the distribution of living standards.
Figure 22.3 brings together many of the examples of policies studied in earlier units. In each case, the policy targets a particular market failure or perceived unfairness. We identify the objective of the policy and the instrument used. The further readings to be found in the units and videos shed light on the extent to which the policy objectives were achieved.
Whilst such policies have been effective in addressing concerns of inefficiency and unfairness in some countries, in Section 22.9 we discuss why market failures and economic outcomes viewed as unfair by many citizens can still persist in democracies.
| Policy | Unit | Market failure or unfairness | Policy objective | Type of policy instrument | Example referred to in the text |
|---|---|---|---|---|---|
| Tax on sugary drinks | 7 | Too much sugar consumption; negative external effects from health consequences | Reduce sugar consumption | Incentives; information | Denmark; France |
| Progressive structure of taxes; monetary and in-kind transfers | 19 | Unfair inequality of market incomes | Reduce unfair inequality of final incomes | Incentives; public provision | Mexico; South Africa; Brazil; EU |
| Reduce tariffs | 18 | Too few imports are purchased (P > MC) | Exploit all possible gains from trade | Incentives | Globalizations I and II; (Dani Rodrik video) |
| R&D subsidies | 12, 21 | Too little R&D | Increase R&D | Incentives | Germany |
| Cap and trade or carbon tax | 20 | Too much CO2 emissions (common-pool resource) | Reduce CO2 emissions | Regulation (cap); incentives (trade) | EU and US (cap and trade) |
| Ban on CFCs | 4 | Emissions damaging ozone layer (common-pool resource) | Eliminate use | Regulation | Montreal Protocol 1989 |
| Patent protection but limited in length | 21 | Too little R&D | Encourage R&D but ensure timely diffusion | Regulation (monopoly on innovation); incentives (for R&D) | Copyright on 19th century operas; US pharmaceutical patents; (Petra Moser video; (F. M. Scherer video) |
| Competition policy to address monopoly | 7 | Too low a quantity is sold (P > MC); monopoly favours owners over consumers | Bring price closer to MC | Regulation | European Commission (Volvo/Scania); US Department of Justice (Microsoft) |
| Land tenure reform | 5 | Poverty among share-croppers; unfair distribution of the crop | Raise farmers’ income as higher share of harvest goes to farmer | Regulation | Operation Barga; West Bengal |
| Minimum wage | 19 | Incomes at the bottom of the income distribution are too low | Reduce poverty | Regulation | US state legislation (Arin Dube video) |
| Eliminate ethnic, gender, or racial discrimination in labour markets | 19 | Unfair inequalities in labour earnings | Raise incomes of targeted groups | Regulation; information | South Africa |
| Mandatory purchase of health insurance or public provision | 12, 19 | Adverse selection: Too little insurance offered; premiums too high for high-risk people | Improve access to health care | Regulation; public provision | UK; US; Finland |
| Capital requirements on banks | 17 | Excessively risky lending with external costs for others (for example taxpayers) | Reduce risk to the financial system and to government finance | Incentives; regulation | Comparison between pre- and post-global financial crisis regulation (Joseph Stiglitz video; Anat Admati video) |
| Inflation-targeting monetary policy | 15, 17 | Unemployment higher than the inflation-stabilizing rate | Keep unemployment close to the labour market Nash equilibrium | Incentives; persuasion | Bank of England, Federal Reserve, and other central banks during the great moderation |
| Labour market reforms (active labour market policy, shorter-duration unemployment benefits) | 16 | Unemployment too high | Improve matching between vacancies and unemployed | Incentives; regulation; information | Hartz reforms in Germany |
| Aggregate demand management policy | 14, 17 | Coordination failure among firms about expected demand | Stabilize aggregate demand | Persuasion; public provision | Comparison between Great Depression and post-Second World War policy regimes (Barry Eichengreen video) |
| International cooperation | 14 | Coordination failure among countries about fiscal stimulus | Prevent collapse in aggregate demand | Persuasion | 2009 London G20 Summit |
| International cooperation | 20 | Coordination failure among countries about climate change mitigation | Reduce CO2 emissions | Persuasion | 2015 Paris Climate Agreement |
| R&D public funding | 21 | Too little R&D | Increase publicly funded R&D (university and other) | Public provision | US military and higher education; UK government; CERN consortium |
| Early childhood intervention in education | 19 | Non-level playing field for children | Increases opportunities for poorer children to attain more advanced schooling | Public provision | Interventions in US (James Heckman video) |
Economic policies aimed at mitigating market failures or addressing unfairness, discussed in earlier units.
Figure 22.3 Economic policies aimed at mitigating market failures or addressing unfairness, discussed in earlier units.
Part of the problem
To accomplish these valuable policies, governments must have extraordinary powers to acquire information and to compel compliance. This creates a dilemma. For the government to be a successful problem-solver, it must also be powerful enough to potentially be a problem itself. Examples from history, and today’s news, show governments using their monopoly on the use of force to silence opposition and to acquire huge personal wealth for their officials and leaders.
Before the French Revolution, Louis XIV of France, called the ‘Sun King’ by his subjects, claimed ‘L’etat, c’est moi’ (I am the state). The word ‘state’ is sometimes used—as the Sun King did here—to mean ‘government in general’, distinguishing it from any particular body such as the government of France. In neighbouring Britain, at almost the same time, William Pitt had a different view of his King, declaring that ‘The poorest man may in his cottage bid defiance to all the forces of the Crown,’ as we saw in Exercise 1.6.
Well-governed societies have devised ways to limit the damage that the use of government powers can inflict without undermining the government’s capacity to solve society’s problems. These have generally included a combination of:
- Democratic elections: To allow citizens to dismiss a government that is using its powers for its own benefit, or the interests of some other small group.
- Institutional checks and balances: Plus constitutional restrictions on what the government can do.
The second point is why Pitt could observe that while the farmer may have difficulty keeping rain out of his cottage, he could confidently exclude the King of England.
In a capitalist economy, barring exceptional circumstances, the government cannot seize what you own, which limits its capacity to enrich itself at your expense. This is an essential limit on arbitrary government powers. An example of a special case would be if you owned a piece of land that was the only possible site for a bridge that was needed to solve a traffic problem. Most governments would have the right to acquire the land at what is independently judged to be a fair price, even if you were unwilling to sell. This power to take private property for public use has many names. For example it is known as the ‘right of eminent domain’ in the US or a ‘compulsory purchase order’ in the UK.
Even with well-designed limits on government powers, and provision for exceptions allowing governments to better serve the public, we will see that governments, like markets, sometimes fail.
- natural monopoly
- A production process in which the long-run average cost curve is sufficiently downward-sloping to make it impossible to sustain competition among firms in this market.
To see why neither markets nor governments may provide ideal solutions to economic problems, think about the case of a natural monopoly that we studied in Units 7 and 12. An example would be the provision of tap water in a city, or electricity transmission over a national network. In these cases, economies of scale means that the most efficient solution would be to have a single entity—a private firm or the government—provide the service.
If it was privately owned as a monopoly, we know that the firm would face a downward-sloping demand curve, which would limit the price at which it could sell its goods. The monopoly firm would both seek to reduce costs and restrict output so that it could charge a higher price. The result would be a price above the marginal cost of production, which would mean that some consumers who value the service at more than its marginal cost would not consume it.
Would the government do a better job?
- economic accountability
- Accountability achieved by economic processes, notably competition among firms or other entities in which failure to take account of those affected will result in losses in profits or in business failure. See also: accountability, political accountability.
- political accountability
- Accountability achieved by political processes such as elections, oversight by an elected government, or consultation with affected citizens. See also: accountability, economic accountability.
- market failure
- When markets allocate resources in a Pareto-inefficient way.
- government failure
- A failure of political accountability. (This term is widely used in a variety of ways, none of them strictly analogous to market failure, for which the criterion is simply Pareto inefficiency).
Ideally a government-owned natural monopoly would set the price equal to the marginal cost and finance the fixed costs through well-designed taxation. But the government may have little incentive to reduce costs. The publicly owned water or electricity supply company may be under pressure to overstaff the company with well-paying jobs for politically connected individuals. As a result, the costs may be higher than they otherwise would be. Wealthy individuals or firms may lobby the government-owned monopoly to provide its services on favourable terms to special-interest groups.
This case illustrates both the similarities and differences between the economic accountability provided by the market and the political accountability provided by a democratic form of government. Both the monopoly firm and the government may act to further their own interests at the expense of the consumer or taxpayer, but they would both operate within constraints. The monopoly firm would not be free to charge whatever price it wished. Its profits were limited by the demand curve. The government would not be free to inflate the costs of provision by only hiring or catering to ‘friends of the government’, because it may suffer an election defeat.
These two cases—private or government ownership of a natural monopoly—illustrate the problem of market failure (the monopoly charging more than the marginal cost) and what is sometimes called government failure (the failure to minimize the cost of providing the service), and the problem of adopting policies in a real world in which neither issue can be avoided entirely.
Which works better? There is no general answer to this question. And there are many choices besides private ownership or government ownership, including:
- private ownership under public regulation
- public ownership with competition among private firms for the time-limited right to produce and price the service
Viewing the government as an economic actor that pursues its objectives, but is constrained by what is feasible, helps us clarify which factors can influence a government to be more of a problem-solver, and less of a problem.5
Exercise 22.1 Building self-control into government
James Madison, a leading figure in the debates about the US Constitution after the formerly British colonies in the United States of America won its war of independence, wrote in 1788:6
In framing a government which is to be administered by men over men, the great difficulty lies in this: you must first enable the government to control the governed; and in the next place oblige it to control itself.
How does democracy (including the rule of law) address Madison’s concerns to oblige the government to ‘control itself’?
Exercise 22.2 The relationship between economic development and size of government
Use Figure 22.2 to help you answer the following questions:
- Why was Pax Britannica a period of smaller government?
- Compare Figure 22.2 with Figure 1.1a. Why do you think that the growth of the size of government coincides with both the emergence of capitalism as an economic system in the seventeenth and eighteenth century, and the increase in output per capita?
- Compare two ‘peacetime’ periods—Pax Britannica, and the period since the end of the Second World War. Why do you think the size of government was so much larger in the second?
22.2 Government acting as a monopolist
As mentioned in the previous section, governments have the power to solve problems, but also cause them. Heads of governments and their associates often misuse their power for personal gain:
- France: The ‘Sun King’ Louis XIV ruled France from 1643 to 1715. Between 1661 and 1710 he constructed a luxurious palace and grounds for himself at the Palace of Versailles, which is now one of the top tourist attractions of the world.
- Ivory Coast: As president from 1960 to 1993, Felix Houphouet Boigny accumulated a fortune estimated to be between $7 and $11 billion, much of it held in Swiss bank accounts. He once asked, ‘Is there any serious man on earth not stocking parts of his fortune in Switzerland?’
- Romania: Nicolae Ceausescu, the head of state under Communist Party rule for over two decades, amassed extraordinary wealth, the most visible parts of which were more than a dozen palaces that had bathrooms with gold-tiled baths and solid-gold toilet paper holders.
- Russia: Personal connections with President Vladimir Putin have allowed a class of business people called oligarchs to obtain hundreds of millions of roubles worth of assets.
Other governments, even undemocratic ones like the ones just mentioned, sometimes provide valuable public services and rule without extravagant personal gain.
Preferences and feasible sets
To understand why governments do what they do, we first model the government as a single individual, and use the usual concepts:
- his preferences
- the constraints which determine which actions and outcomes are feasible for him
We consider the government as a single actor, but in fact it is made up of a large number of actors. And just as managers and owners of firms have a wide variety of motivations, so do those in government. The following motives are common among those in leadership roles in government:
- Benevolence: To improve the wellbeing of citizens.
- Nepotism: To give special importance to a particular group, such as the region from which government leader comes, or a particular religion.
- Self-interest: Using the power of the government position for personal enrichment.
To begin, we model the government as a ‘political monopolist’, which means there is no competition from elections that could remove it from power. We call this the ‘government as monopolist’ model, and a government like this is referred to as a dictatorship. Even in the absence of elections, the dictator faces a feasibility constraint: his powers are not unlimited, because if he takes too much from the population, he may be removed from office by an uprising of citizens.
Depending on its preferences and the constraints it faces, the government may use the tax revenues it collects for a variety of purposes, which may include:
- The provision of services to virtually all citizens: These include schooling and health.
- The delivery of government services or other benefits to a narrowly targeted group: These might be well-paying jobs, or special reductions in tax obligations.
- Granting substantial incomes to themselves: Or other economic benefits, to themselves or their families.
A rent-seeking dictator
As with all models, we simplify greatly so as to focus on the most important aspects of the problem:
- the ‘dictator’ is entirely selfish
- he decides on a tax that he will collect from the citizens …
- … and keeps the tax revenue, apart from his spending on a public service (such as basic health services or schooling) for the citizens …
- … whom he provides for because if he keeps too much, a popular uprising may remove him from office
While simple, this model captures some key realities:
- The Romanian people revolted against Nicolae Ceausescu in 1989 after he had been in office for 29 years. The armed forces joined the revolt, and he and his wife were executed.
- Louis XVI of France was removed from power in a revolution in 1789, during which thousands of armed men and women besieged the Palace of Versailles. He was executed by guillotine in 1793.
- political rent
- A payment or other benefit in excess of the individual’s next best alternative (reservation position) that exists as a result of the individual’s political position. The reservation position in this case refers to the individual’s situation were he or she to lack a privileged political position. See also: economic rent.
The costs of the public service include what the dictator would earn as a normal civilian. The amount the dictator receives (taxes in excess of the costs of the public service) is called a political rent:
- It is a rent: This is what the dictator gets above and beyond his next best alternative (namely, working as an ordinary civilian).
- The rents are political: They exist as a consequence of the political institutions in force. The dictator receives an income above his reservation income because he occupies a position of power in government.
These rents are an example of persistent (or stationary) rents (as in Figure 11.23). Unlike the stationary rents that encourage workers to work hard and well, or the dynamic rents received by successful innovators, these rents do not play a useful role in the economy. They are simply a reward for having power.
Rent-seeking by the dictator (activities to enlarge or to perpetuate these high incomes) often involves using the economy’s resources to police the population in order to keep the dictator in power, rather than to produce goods and services. These are similar to some of the rent-seeking activities of a profit-maximizing firm—advertising or lobbying the government to gain a tax break, for example—but are different from other rent-seeking activities such as innovation, which often creates substantial economic benefits.
To simplify the dictator’s decision-making problem, we assume that the dictator does not choose the public service to supply—the public service is taken as given. The dictator only chooses how much to collect in taxes.
Even a dictator faces constraints on what he can do
As in Unit 5, when Bruno was using his coercive powers to exploit Angela, the dictator will not want to collect so much in taxes that the citizens would lack the strength and ability to produce. But the dictator will face an additional constraint: if the taxes are too high, the citizens will try to remove him from power, by revolting or engaging in other forms of civil unrest.
We assume there are two reasons for removing the dictator:
- Performance-related reasons: He collects too much tax, for example.
- Reasons unrelated to performance: The dictator has no control over these.
The dictator wants to maximize the total political rent that he can expect to get over his period in office, not the rent he can get in any particular year. So he has to think about how long he is likely to last. Of course, this is impossible to predict, but he will reasonably expect that if he is providing a given amount of the public service, then the lower the taxes he imposes, the longer his duration in office will be.
Figure 22.4 illustrates how a forward-looking dictator would evaluate two possible levels of taxation. With the higher tax, the dictator gets a larger rent per year but for a shorter time in office, because the likelihood of being removed is greater.
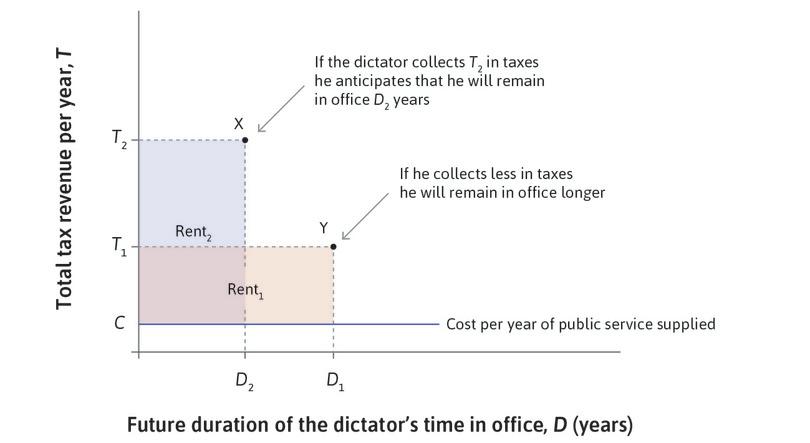
The forward-looking dictator contemplates the total political rent he will get with two different levels of annual taxation.
Figure 22.4 The forward-looking dictator contemplates the total political rent he will get with two different levels of annual taxation.
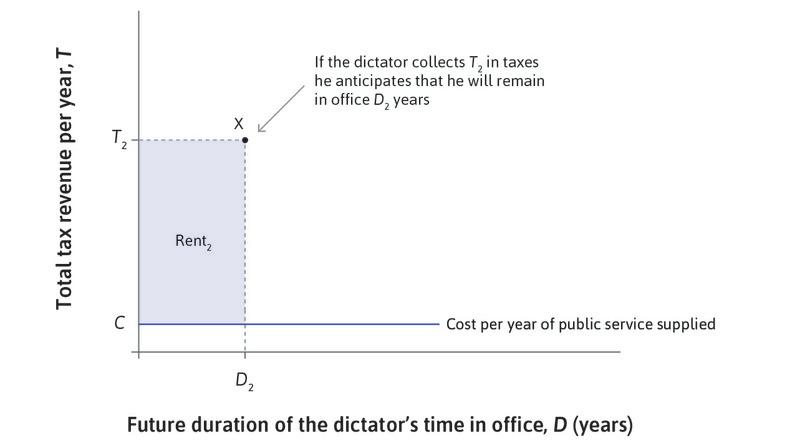
Higher tax
If the dictator collects T2 in taxes, he anticipates that he will remain in office for D2 years. His total political rent is (T2 − C)D2, where C is the cost of supplying the public good.
Figure 22.4a If the dictator collects T2 in taxes, he anticipates that he will remain in office for D2 years. His total political rent is (T2 − C)D2, where C is the cost of supplying the public good.
Lower tax
If he collects less in taxes, he will expect to remain in office longer. His total political rent is (T1 – C)D1.
Figure 22.4b If he collects less in taxes, he will expect to remain in office longer. His total political rent is (T1 – C)D1.
Assuming the private sector does not also provide this service to the public, you can think about the government as a monopolist providing the public service at a ‘price’ (the tax), which citizens are legally obliged to pay. The dictator faces a constraint similar to a demand curve. Just as the amount a monopolistic firm is able to sell is inversely related to the price that it sets, the duration of the government’s time in office is inversely related to the tax rate it sets.
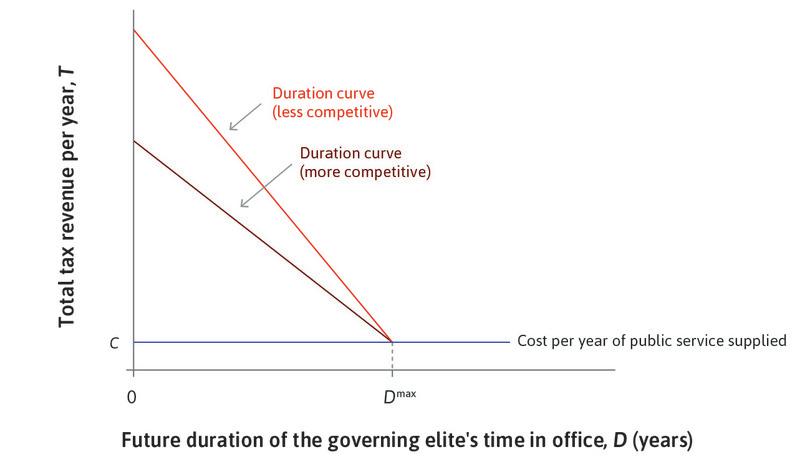
Figure 22.5 shows how the tax rate imposed by the dictator affects the expected duration of the government, defined as the number of years he may expect to stay in office following this year.
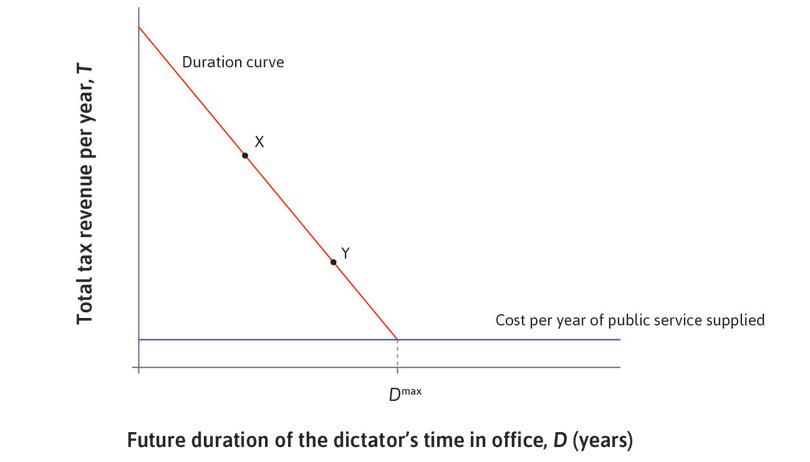
The duration curve: The dictator sets the tax given the cost of the public service.
Figure 22.5 The duration curve: The dictator sets the tax given the cost of the public service.
What is the longest time (Dmax) that the dictator could expect to remain in office? To figure this out, imagine that our dictator suddenly lost interest in money and simply wanted to remain in office as long as possible. What would he do?
He cannot reduce the probability that he will be removed for reasons unrelated to his performance. But he can reduce the ‘performance-related’ probability of being removed by only collecting enough taxes to meet the production costs of the public service. In Figure 22.5, Dmax is therefore where the duration curve meets the cost line. It is the expected duration when only considering factors unrelated to the dictator’s performance. Any tax rate above the cost of production will reduce the expected duration below Dmax, as shown by the downward slope of the duration curve.
Leibniz: Expected duration of the dictator or governing elite
The duration curve goes through points X and Y in Figure 22.4 and does not go below the cost line because if it did, the dictator would be paying out of his own pocket toward the cost of the public service. A dictator in a country with a stronger rule of law—and therefore a lower likelihood of a coup unrelated to performance—would face a duration curve that meets the cost line to the right of the one shown.
The duration curve is the feasible frontier for the dictator. Points in the feasible set above the cost curve result in positive rents for him. The curve represents a familiar trade-off:
- Higher taxes: More rents in the short run at the cost of a greater likelihood of an early dismissal from office. A shorter duration in office is the opportunity cost of higher rents per year.
- Lower taxes: The dictator earns rents for longer, but at a lower level per year. Lower rents per year is the opportunity cost of a longer duration in office.
The dictator chooses a tax to maximize his total rents
How does a dictator facing a duration curve decide the tax rate to impose on the citizens? The answer is similar to the way that a monopolistic firm decides on the price to charge for its product. This can be seen in Figure 22.6.
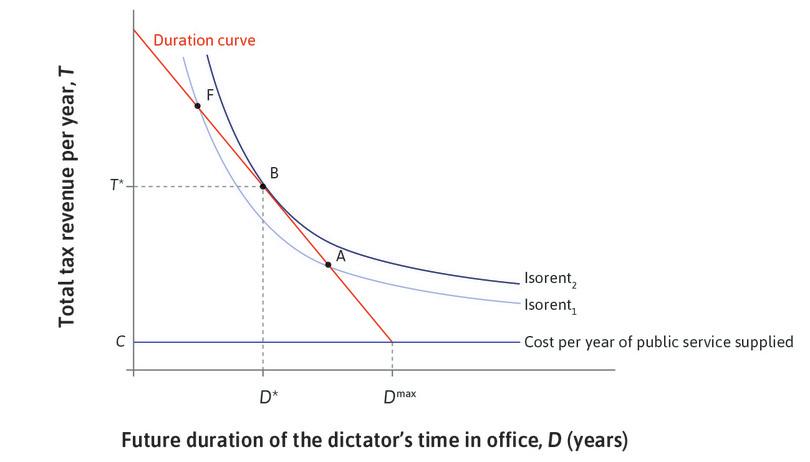
The dictator chooses a tax level to maximize his political rents.
Figure 22.6 The dictator chooses a tax level to maximize his political rents.
The dictator will find the tax that maximizes his total expected political rent, which as in Figure 22.6 will be
This is analogous to the profit-maximizing firm that chooses the price that allows it to get the highest expected profits equal to (P − C)Q, where P is the price charged by the firm and Q is the quantity sold.
Convexity means that for a given value of D, moving upwards in the figure (increasing T) makes the curves steeper, while for a given T, moving to the right (increasing D) makes the curves flatter.
Just as we used the firm’s isoprofit curves to determine the price it would charge in order to maximize profits, we can now use the dictator’s isorent curves shown in the figure to determine the tax rate it will impose on the citizens. The shape of the isorent curves is similar to the isoprofit curves:
- Higher isorent curves are further from the origin.
- The absolute value of their slope is (T − C)/D.
- They are ‘bowed inward’ (convex) towards the origin, as shown in the figure.
- The ‘no rent’ isorent curve is the horizontal cost line (its slope is zero).
Now suppose the dictator is considering setting a modest tax and expecting a long tenure in office, indicated by point A. Because the isorent curve is flatter than the duration curve at this point, we can see that he would do better by raising the tax and bearing the opportunity cost associated with doing so (a shorter expected stay in office).
Continuing this reasoning, we can see that the tax rate indicated by point F on the duration curve gets the dictator a large surplus per year, but not enough to offset the short duration of his government. A lower tax rate would increase his expected rent.
Leibniz: How the monopolist sets the rent-maximizing level of taxes
To maximize his political rent, the dictator will select point B, imposing the tax T* and expecting to stay in office for D* years, making a total rent of (T* − C)D*. At this point, the slope of the highest isorent curve is equal to the slope of the feasible frontier (the duration curve):
Question 22.1 Choose the correct answer(s)
Consider Figure 22.6. Which of the following statements is true?
- False. Dictators will maximize total expected rent, which will require taxes to be below the maximum level (as at T* in the diagram above).
- False. It improves outcomes for the dictator. However, outcomes will be worse for the citizens, who will have to pay higher taxes with no improvement in public services or increase in public service provision.
- False. T* is the optimal taxation rate. Further increases in tax rates will decrease total expected rent because the decrease in expected duration will outweigh the increase in annual rent.
- True. Dictators cannot appropriate all of the tax revenue as rent, but must spend at least C to provide essential public services (rule of law, defence etc.) to avoid being overthrown.
22.3 Political competition affects how the government will act
Just as competition disciplines firms in the economy by limiting the profits they can get by setting too high a price, competition to win elections is the way that a democracy disciplines its politicians to provide the services desired by the public at a reasonable cost (in terms of taxes). Below we give some evidence of this from the US.
There is also evidence from other countries that the prospect of being removed from office affects what politicians do. The introduction of village-level elections in China led to increased provision of local public services such as health services and schooling, and arguably a reduction in corruption.7
Even in undemocratic settings, the threat of losing office can discipline politicians. In China, provincial governors and Communist Party secretaries are not subject to review by voters but instead by higher officials in the central government. Governors and party secretaries are frequently promoted and almost as frequently fired. The records of all terminations over the period 1975–1998 show that those whose provinces experienced rapid economic growth were promoted, while those whose provinces lagged behind in growth were dismissed.
How economists learn from facts Does electoral competition affect policy?
Think of a politician as wanting to stay in office and knowing that she must satisfy a majority of voters when seeking re-election. But she also has her own objectives: to advance a particular project that she favours, or to maintain good relations with wealthy individuals who will support her political campaigns or employ her when her political career is over. Does the threat of ‘give the voters what they want or get thrown out’ lead her to emphasize the public’s interests, instead of her own?
Just comparing the policies adopted by politicians in districts that are non-competitive (for example, there will be no other candidate for the seat) with those who face electoral competition will not answer the question. The reason is that competitive and non-competitive political districts, and the politicians who represent them, are different in so many ways that the comparison would mix the effects of political competition with the effects of these other differences.
Economists Tim Besley and Anne Case devised an ingenious way to answer the question. Some state governors in the US are limited to two four-year terms of office. This means that at the end of their first term they will face electoral competition when they ask voters to re-elect them. During their second term, the prospect of political competition does not affect them, because they are not allowed to stand for re-election.
Considered as an experiment, the ‘treatment’ is the prospect of electoral competition, the governors in the first term are the ‘treatment group’ and the same governors in the second term are the ‘control group’. As in any good experiment, other important influences are held constant. We are measuring the same individuals, in the same districts, under a treatment and a control condition.
They found that during their first terms (the treatment period), Republican and Democratic governors implemented virtually identical levels of total taxation per capita. But during their second terms (the control period), Democratic Party governors, who tend to favour more public expenditures and taxation, implemented much higher levels of taxation than Republicans did. And Republican governors, when not facing political competition, implemented much lower levels of the state minimum wage.
Whether Democrat or Republican, governors faced with electoral competition in their first term implemented very similar policies to those favoured by the ‘swing’ voters who tend to change who they vote for, and so tend to decide many elections—lower taxes and higher minimum wages. But they diverged according to their own political preferences or economic interests when electoral competition was removed.
Political competition as a constraint
- governing elite
- Top government officials such as the president, cabinet officials, and legislative leaders, unified by a common interest such as membership in a particular party.
Next, we introduce political competition to the model to see how it affects the government’s choice of tax level. The government leadership is no longer represented by a dictator, but instead by what we call a governing elite, that is the top government officials and legislative leaders, unified by a common interest such as membership in a particular party. Unlike a dictator, the elite can only be removed from office by losing an election, and not by a citizen uprising or some other non-electoral means.
When we speak of its removal from power or the duration of its time in office, we do not mean the removal of an individual (as might have been the case with a dictator), but rather the entire group and its affiliation with a political party. In the US, for example, the Republican Party governing elite was removed from office in 2008, when President Obama was elected. The Democratic Party governing elite associated with President Obama was removed from office when President Trump was elected eight years later.
In the model, there are now two ways that a governing elite can be removed from office, both of which occur through elections (although, of course, reality is more complex):
- Performance-related reasons: It collects too much tax, for example.
- Reasons unrelated to performance: Even governing elites that serve the interests of their citizens often lose elections.
Figure 22.7 illustrates a few of examples of governing elites’ duration in office and the reasons that they eventually left office. The longest continuous rule by a governing elite was the government of the Mexican Institutional Revolutionary Party (PRI), which governed Mexico from the time of the Mexican revolution in the early twentieth century right into the twenty-first century. The longest rule by an individual at the head of a governing elite was by Fidel Castro (49 years) in Cuba, who was then succeeded by his brother Raul. The shortest period in office in this table is the elected government of Gough Whitlam in Australia, which was removed by the Governor General (not an elected official) following a parliamentary impasse over the budget.
| Governing elite | Country | Rule | Came to power by | Left power by |
|---|---|---|---|---|
| Congress Party | India | 1947–1977 | Election (end of colonial rule ) | Election |
| Communist Party | Cuba | 1959– | Revolution | Still in power as of 2017 |
| Social Democratic Party | Sweden | 1932–1976 | Election | Election |
| Second Republic | Spain | 1931–1939 | Election | Military coup civil war |
| Francisco Franco | Spain | 1939–1975 | Military coup, civil war | Natural death; return to democracy |
| Institutional Revolutionary Party | Mexico | 1929–2000 | Election | Election |
| Democratic Party | US | 1933–1953 | Election | Election |
| Sandinista Party | Nicaragua | 1979–1990 | Revolution | Election |
| African National Congress | South Africa | 1994– | Non-violent revolution & election | Still in power as of 2017 |
| Australian Labor Party | Australia | 1972–1975 | Election | Dismissed by (unelected) executive |
Examples of governing elites, their period of rule, and reasons for their end.
Figure 22.7 Examples of governing elites, their period of rule, and reasons for their end.
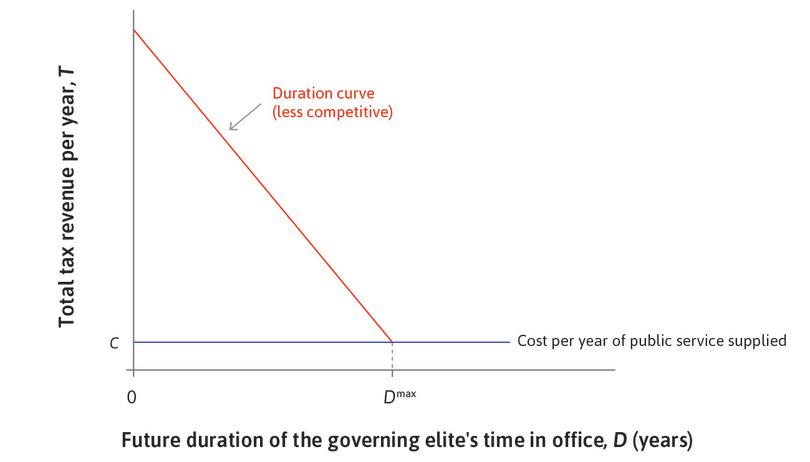
The key idea in our model is that political competition makes the likelihood of losing an election more dependent on the government’s performance. This means that it makes the duration curve flatter. In other words, an increase in taxes by the government will have a larger effect on the elite’s expected duration in office than it would if there was no political competition.
The response of expected duration to the change in taxes is:
This is the inverse of the slope of the duration curve. If we have weak political competition, the duration curve is steep, just as a steep (inelastic) demand curve indicates weak competition in a market for goods or services.
The flatter, more competitive, duration curve that you see in Figure 22.8 shows a situation in which raising taxes above the cost of providing the public services is associated with a reduction in the current governing elite’s period in power.

The feasible set for taxes and government duration in a relatively uncompetitive and competitive political system.
Figure 22.8 The feasible set for taxes and government duration in a relatively uncompetitive and competitive political system.
A dictatorship
In a dictatorship, the duration curve is steep.
Figure 22.8a In a dictatorship, the duration curve is steep.
A flatter curve
The more competitive duration curve (darker) is flatter.
Figure 22.8b The more competitive duration curve (darker) is flatter.
A rise in taxes
Raising taxes to T’ above the cost of providing the public services is associated with a more substantial reduction in the current government’s expected lifetime when political competition is stronger.
Figure 22.8c Raising taxes to T’ above the cost of providing the public services is associated with a more substantial reduction in the current government’s expected lifetime when political competition is stronger.
The model helps show why governing elites, and the wealthy and powerful members of society who are allied to these elites, have so often resisted democracy, and attempted to limit the political rights of the less well off. In Figure 22.9, voting is initially restricted to the wealthy and as a result, the elite faces little political competition (the duration curve is steep), and maximizes its rents at point B. But now suppose that everyone has the right to vote and that opposition political parties are allowed to challenge the elite. This increase in political competition is represented by the flatter duration curve, indicating that the feasible set of the elite has shrunk. It now chooses point G, and collects lower taxes per year.
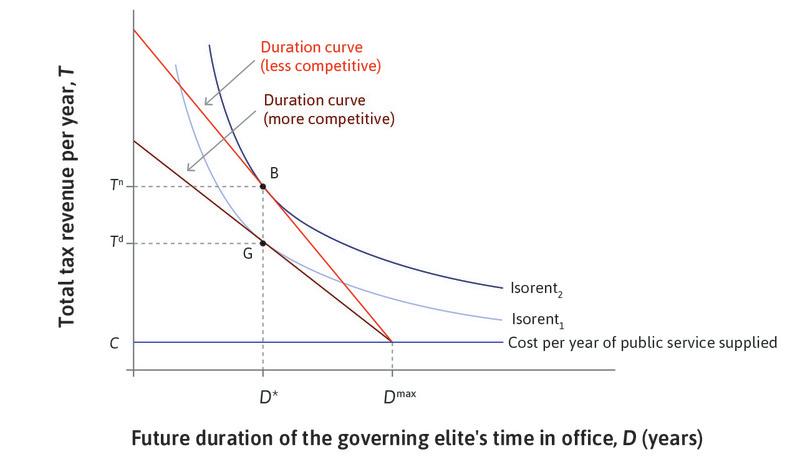
Choice of taxes under less and more competitive conditions.
Figure 22.9 Choice of taxes under less and more competitive conditions.
Notice that, in the figure, the governing elite in a more competitive political system implements lower taxes but has the same expected duration as the elite in the less competitive system (with higher taxes). But this need not be the case. Generally, the duration could be longer or shorter if conditions become more competitive.
- substitution effect
- The effect that is only due to changes in the price or opportunity cost, given the new level of utility.
- income effect
- The effect that the additional income would have if there were no change in the price or opportunity cost.
You are already familiar with the reason why the expected duration might not change after increase in political competition. There are two offsetting effects:
- Raising taxes bears a heavier risk of the governing elite being dismissed: We can see the duration curve is flatter. This is the substitution effect: leading the governing elite to choose a higher expected duration and lower rent per year.
- The governing elite has lost some of its power: The inward shift of the duration curve means that it will now receive lower rents whatever it does. This is the income effect that results in the governing elite choosing a lower expected duration, and lower tax rate.
In the case we have shown, the substitution effect happens to exactly offset the income effect.
Leibniz: The income and substitution effect of an increase in political competition
Exercise 22.3 Comparing duration curves for governments and monopolistic firms
How is the duration curve in Figure 22.8 similar to and different from the demand curve faced by a monopolistic firm that you studied in Unit 7?
Exercise 22.4 Income and substitution effects
Applying what you learned about income and substitution effects and how they can be analysed in a diagram with indifference curves and feasible frontiers (from Unit 3), redraw Figure 22.9 to show the decomposition of the final choice after increased competition into the income effect (reduction in duration, D) and the substitution effect (increase in D).
22.4 Why an erstwhile dictator might submit to political competition
We have now seen two versions of the ‘government as monopolist’ model: one in which the ‘government’ is a dictator who may be overthrown, as Louis XVI and Nicolae Ceausescu were, and the other in which the governing elite is subject to electoral competition, with the possibility that another political party may defeat it in an election and become the new governing elite.
Over the course of the past 200 years, many countries have seen an increase in the degree of political competition so that the ‘political competition’ version of the ‘government as a monopoly’ model applies more often than the ‘dictator’ version.
Read more on South Africa’s and El Salvador’s transitions to democracy in this book: Elisabeth Jean Wood. 2000. Forging Democracy from Below: Insurgent Transitions in South Africa and El Salvador. Cambridge: Cambridge University Press.
This has happened in many cases because governing elites have found it in their interest to concede to a more competitive political system, or even introduce one on their own initiative:
- South Africa: You already read that the population of European origin (those who were both business and governing elites) responded to waves of industrial strikes, community protests, and student stay-away-from-school demonstrations by extending the vote to all adult South Africans, irrespective of race.
- El Salvador: After 10 years of civil war, and faced with an armed insurrection that they could not defeat, the economic, political, and military elites of El Salvador conceded to the demands of their opponents that the country should adopt a democratic political system.
- The US: At the time of adoption of the US Constitution in the late eighteenth century, James Madison, the author of The Tenth Federalist Paper, thought that the only way to ensure stability was to increase democracy. He persuaded his fellow wealthy landowners (and slave owners) to take a chance on democracy for this reason. The result was the ratification of the US Constitution in 1788, which despite its recognition of slavery as a legal institution, is considered to be a landmark on the long journey to a full democracy.
Faced with unrest, one way the governing elite in an undemocratic political system could increase the stability of the system would be to use the coercive powers of the government to imprison and intimidate opponents who would expose the extent of the government’s political rents. Nevertheless, there are limits to the effectiveness of these ‘police state’ strategies, as illustrated by the white governing elite under apartheid in South Africa, who attempted to do this, and failed. The elite of the Communist Party of the German Democratic Republic (East Germany) also discovered the limits to its ability to impose stability by force. Popular demonstrations and challenges to the government were successful, in part because the police and armed forces eventually could not be counted on to defend the incumbent government.
An alternative way to ensure stability is to introduce changes in the political system that make it more democratic, providing the dissatisfied with legal means to seek a change in government.
A greater degree of democracy will ‘flatten’ the duration curve, thereby reducing the size of the elite’s feasible set, as we showed in Figure 22.9. If greater democracy also increased the stability of the political system however to the extent shown in Figure 22.10, it might allow the elite an even greater expected rent at the point A′. This would be possible because the increased expected duration of the government, due to increased stability, would more than offset the reduced taxes that could be imposed due to the increased power of the citizens to dismiss the government for excessive rent-taking. In Figure 22.10, the greater expected rent at A′ is shown by the larger area of (T** − C)D** as compared with (T* − C)D*.
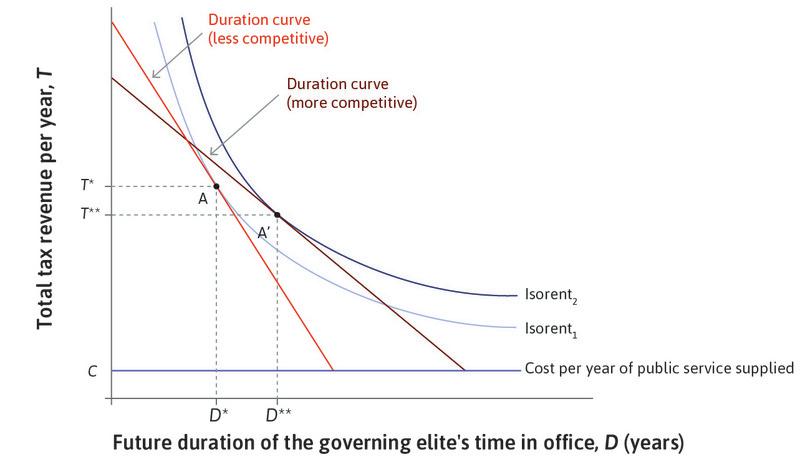
Effect of greater stability and competition: A case where the elite gains.
Figure 22.10 Effect of greater stability and competition: A case where the elite gains.
Exercise 22.5 Effects of cost-saving improvements to public services
Suppose the elite can introduce a policy that will provide the same level of public services at a lower cost. This would be called an increase in the effectiveness of the government. An example might be that the government could adopt teaching methods that are more effective, or find ways to motivate teachers to improve their teaching. Or the government could require that the construction firms that build public infrastructure, such as roads, compete with each other rather than colluding in setting high prices.
- Which curves in the diagram will this change alter? Draw a figure depicting this new situation. Hint: The (absolute value of the) slope of the isorent curves is (T − C)/D.
- Explain why the governing elite would want to introduce these policies.
- Can you say if the elite will levy the same level of taxes, higher taxes, or lower taxes?
- Can you think of reasons why these policies might not be introduced?
Question 22.2 Choose the correct answer(s)
Consider Figure 22.10. Which of the following statements is true?
- True. Citizens benefit from both lower tax rates and longer expected durations (assuming that regime change is costly for citizens). The elite increases its total expected rent.
- False. In this example, the total expected rent of the elite increases. But in other situations, such as that shown in Figure 22.8, the government ends up on a lower isorent curve.
- False. In the example above, if the elite maintained a tax rate T* following the shift in the duration curve it would still reach a higher isorent curve than they were previously on.
- False. The substitution effect caused by the flattening of the duration curve will cause an elite to charge lower tax rates.
22.5 Democracy as a political institution
We have seen that like firms, the government (treated in the model as if it were a single person) is an important economic actor. As an actor, the government imposes laws, fights wars, collects taxes, and provides public services such as the rule of law, stable currency, roads, healthcare, and schools. But, like firms, the government is also a stage. On the stage of government, politicians, political parties, soldiers, citizens, and bureaucrats interact according to the informal and formal rules that constitute political institutions.
- political institutions
- The rules of the game that determine who has power and how it is exercised in a society.
The political institutions of a country are the rules of the game that determine who has power and how it is exercised in a society. Democracy is a political institution, which means it is a set of rules that determine
- who makes up the government
- the powers they can use when governing
Political institutions differ from country to country and over time. But major categories of political institutions include democracy and dictatorship.
The key value motivating democracy is political equality. Citizens should have substantially equal opportunities to be able to express their views in ways that can shape the policies and other activities of the government.
Democracy is sometimes advocated as a means to ‘let the people rule’, or in Abraham Lincoln’s words, a ‘government of the people, by the people and for the people.’ But who ‘the people’ are and what ‘the people’ want is difficult to determine. Kenneth Arrow is the economist who contributed most to our understanding of the problems that elections sometimes encounter in selecting between different courses of action.
Great economists Kenneth Arrow
Kenneth Arrow (1921–2017) was born in New York City to Romanian-American parents. His essay ‘A cautious case for socialism’ explains how the Great Depression and the Second World War influenced his ideas, especially those of ‘freedom and avoidance of war’.
A good summary of Kenneth Arrow’s explanation of the problems of using voting to determine which action is preferred, and his broader contributions to economics and social science, are in Steven Durlauf’s essay ‘Kenneth Arrow and the golden age of economic theory’.8
In addition to his work on voting systems, he was among the first to demonstrate that there were conditions under which something like Adam Smith’s ‘invisible hand’ would work. Characteristically scholarly and detached from ideological rhetoric, he later wrote:
There is by now a long and … imposing line of economists from Adam Smith to the present who have sought to show that a decentralized economy motivated by self interest and guided by price signals would be compatible with a coherent disposition of economic resources that could be regarded … as superior to a large class of possible alternative dispositions. … It is important to know not only whether it is true but whether it could be true. (original emphasis) (General Competitive Analysis, 1971)
Arrow was a pioneer in the study of many of the themes in The Economy, including asymmetric information and the economics of knowledge, and helped broaden the scope of economics to include insights from other disciplines. A year before his death, Arrow co-taught a course about inequality at Stanford University using an early draft of Unit 19 of this book, which was revised in light of his comments.
In Unit 1 we explained that we use the word democracy to refer to a form of government in which three political institutions exist:
- Rule of law: All individuals are bound by the same laws, and nobody—not even the most powerful government official—is ‘above the law’.
- Civil liberties: The members of a society are guaranteed rights of free speech, assembly, and the press.
- Inclusive, fair, and decisive elections: Fair elections in which no major population group is excluded from voting, and after which the losing party leaves office.
Ideally, in a democracy those who have power are elected in an inclusive and open competitive process, and the rule of law and civil liberties limits the things they can do with that power.
Democracy has been advocated as a good political system on two quite different grounds:
- Democracy in its own right: As a political system consistent with individual dignity and freedom.
- Democracy as a way of addressing national problems: As a system that works better than other methods.
Here we focus on the consequences of democracy for addressing problems (the second point), not on its intrinsic merits (the first point).
No existing government fulfils the democratic ideal of political equality, where each citizen has equal influence over an outcome. Similarly, no government today can be said to perfectly match the three political institutions that define democracy.
Think about inclusive elections. Some population groups—those convicted of major crimes, for example—are excluded from voting in many countries, but we still consider the country’s political system as democratic. However, exclusion of a major population group—women, for example, as was common in recent history—is a sufficiently serious violation of the ‘inclusive elections’ criterion to disqualify a country from the club of democratic nations. Some examples include:
- West Bengal: To see how important restricting the right to vote can be, recall that in Unit 5, we examined the implementation of a land reform in West Bengal called Operation Barga and used the Lorenz curve to illustrate the effect of the reform in Figure 5.18. We can now see how inclusive elections could affect the likelihood that reforms like this take place. In the hypothetical case that only landowners have the vote, then if they vote in their own economic interests, they would not support a party pledged to implement such a reform (recall that in the example shown in Figure 5.18, the landowners’ share of the crop fell from 50% to 25% following the reform). Since the landowners make up only 10% of the population, if there was universal suffrage, the result would be different. The farmers making up the majority of the electorate would vote for a party proposing the land reform. In real life, the political party that introduced the reforms in West Bengal went on to win elections and, as a result, control of the state government for three decades.
- The US: The Voting Rights Act of 1965 secured the vote for large numbers of effectively disenfranchised African American citizens. The result was a substantial shift in educational spending in districts with large numbers of previously excluded black voters.
- Brazil: In Brazil, before the mid-1990s, casting a valid ballot required that voters could read and write reasonably well (which perhaps a quarter of the population could not). Around 11% of ballots cast were declared invalid due to communication barriers, most of them cast by poor voters. New electronic voting introduced in 1996 used pictures of candidates, an interface similar to phone keypads or ATM screens, and prompted the voter through the process step by step. The effect was to increase the number of valid votes made by the poor. The resulting change in the nature of the electorate led elected political leaders to prioritize the kinds of spending predominantly benefiting the less well off. Expenditure on public health, for example, increased by more than a third.9
As we will see in the following sections, how a government actually works is not determined solely by the presence or absence of civil liberties, the rule of law, and inclusive fair elections.
22.6 Political preferences and electoral competition: The median voter model
One of the puzzles of politics is that in two-party electoral systems, parties often offer programs that are remarkably similar. It provokes the criticism that democracy doesn’t offer a real choice. Here are some examples:
- What size should the government be?: Substantial differences in party objectives and political values—about the appropriate size of the government, for example—have divided Britain’s Labour and Conservative Parties since the end of the Second World War. But look again at Figure 22.2, showing the size of the UK government. The big change was an increase during the Second World War. Since then, one can detect the ups and downs of spending in the Labour and Conservative years, but the size of the government has not changed much.
- What should the government do?: In the Indian state of Kerala, for the past half-century the elected state government has alternated between the centrist Congress Party (and its allies) and the Communist Party (and its allies). Since the first elected Communist-led government, power has changed hands seven times. In this time, the fundamental priorities of the government have changed little, affirming a strong emphasis on education, health, and other public services.
To understand why political parties sometimes adopt ‘lookalike’ policies, we borrow a model from economics. Just as firms compete for purchases from customers, in democracies, political parties compete for votes from citizens by offering party platforms, which consist of policies that they say they will enact if elected. We will consider a simple majority-rule system in which the party or candidate with the most votes wins.
The median voter and party platforms in an ideal democracy
Imagine a situation in which there are only two parties, one of which represents the ‘left’ of politics (favouring higher taxes and government spending, for example) and the other the ‘right’ (favouring lower taxes and government spending). If the parties care only about winning an election, in what conditions will they offer distinctive platforms tailored to their respective core supporters? And if they offer similar programs, at which point on the political spectrum will that be?
We can provide some answers to these questions using a model developed by Harold Hotelling, an economist. He had imagined the location of stores along a railway line. In his article, Hotelling also applies his model of competition to the political platforms of the Democratic and Republican Parties in the US.10
We will apply Hotelling’s model to ice creams. Imagine a stretch of beach along which bathers are spread evenly. They can purchase ice cream from one or more mobile ice cream stands. Initially we assume that every bather will buy one ice cream, and that all ice creams cost the same. If there is more than one vendor, they will purchase the ice cream from the vendor located closest to them.
- median voter model
- An economic model of the location of businesses applied to the positions taken in electoral platforms when two parties compete that provides conditions under which, in order to maximize the number of votes they will receive, the parties will adopt positions that appeal to the median voter. See also: median voter.
Understanding where the ice cream sellers choose to locate on the beach (to the right, to the left, in the middle) will help us understand where political parties would locate along the high tax (left) to low tax (right) continuum. This is called the median voter model.
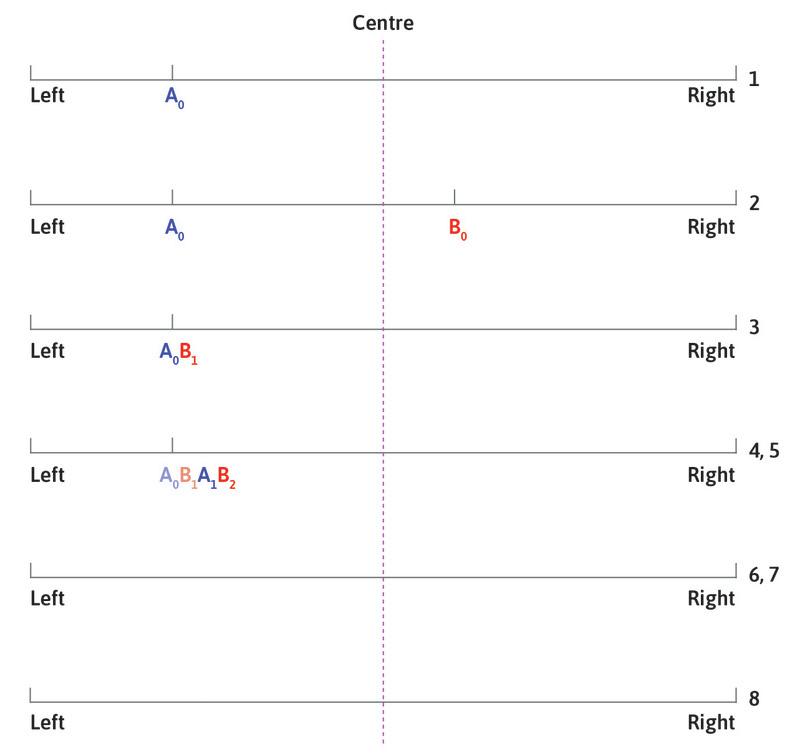
To begin, a single vendor, April, is at the beach. She has the entire market to herself so it doesn’t matter where she is located. Suppose she is at a location shown by A₀ in Figure 22.11, on the left of the beach.
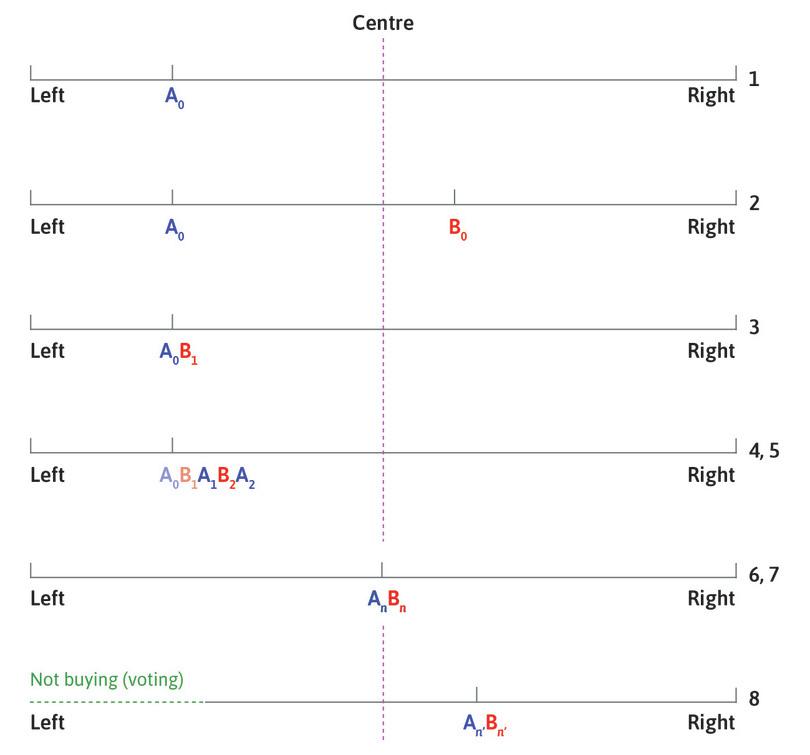
Ice cream sellers at the beach: The median voter model of electoral competition and party platforms.
Figure 22.11 Ice cream sellers at the beach: The median voter model of electoral competition and party platforms.
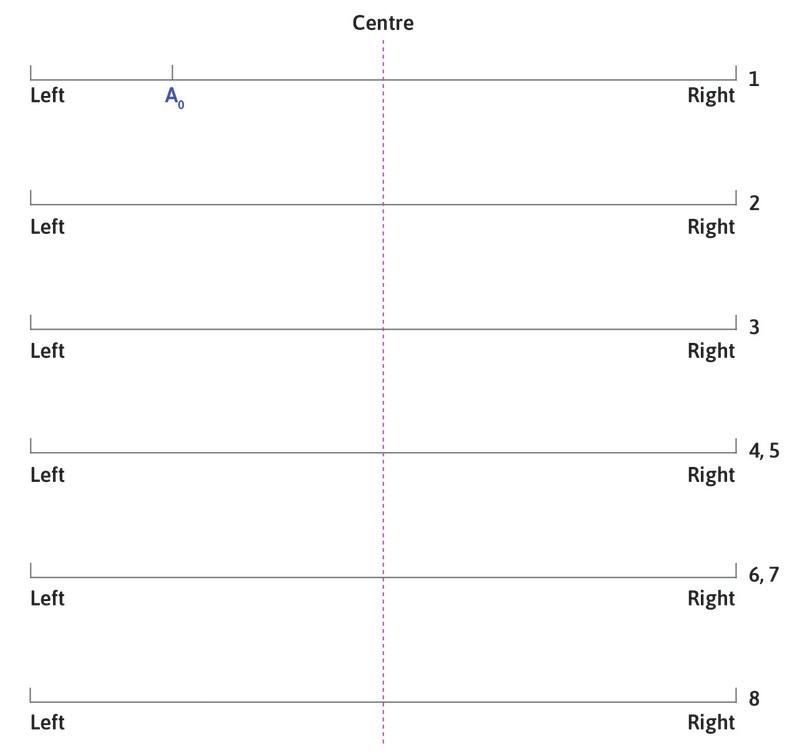
A single vendor
A single vendor, April, arrives at the beach and locates her ice cream stand at A0.
Figure 22.11a A single vendor, April, arrives at the beach and locates her ice cream stand at A0.
A second seller
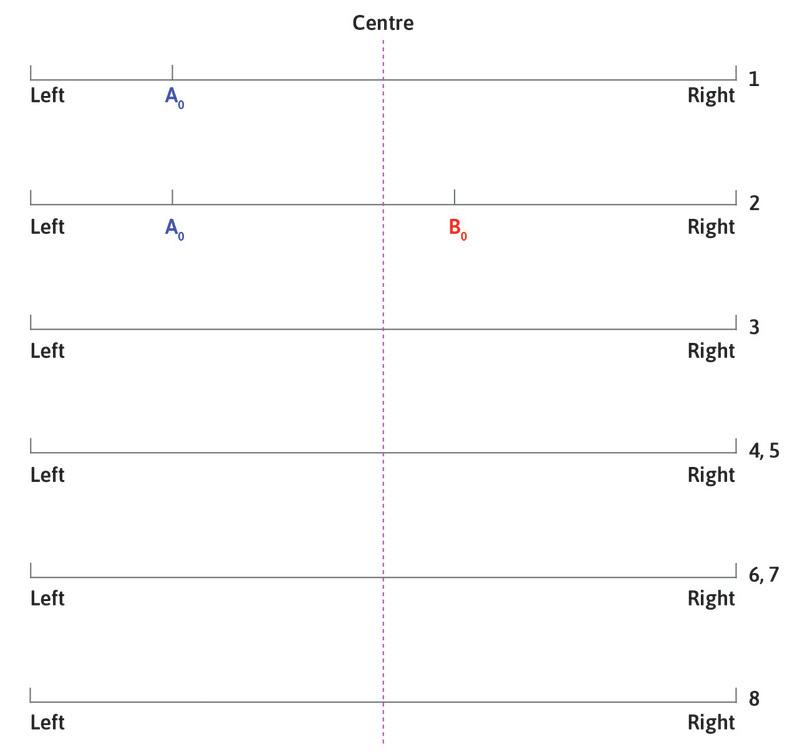
A second seller, Bob, arrives and sets up at B0, midway between April and the right-hand end of the beach.
Figure 22.11b A second seller, Bob, arrives and sets up at B0, midway between April and the right-hand end of the beach.
Bob shifts to the left
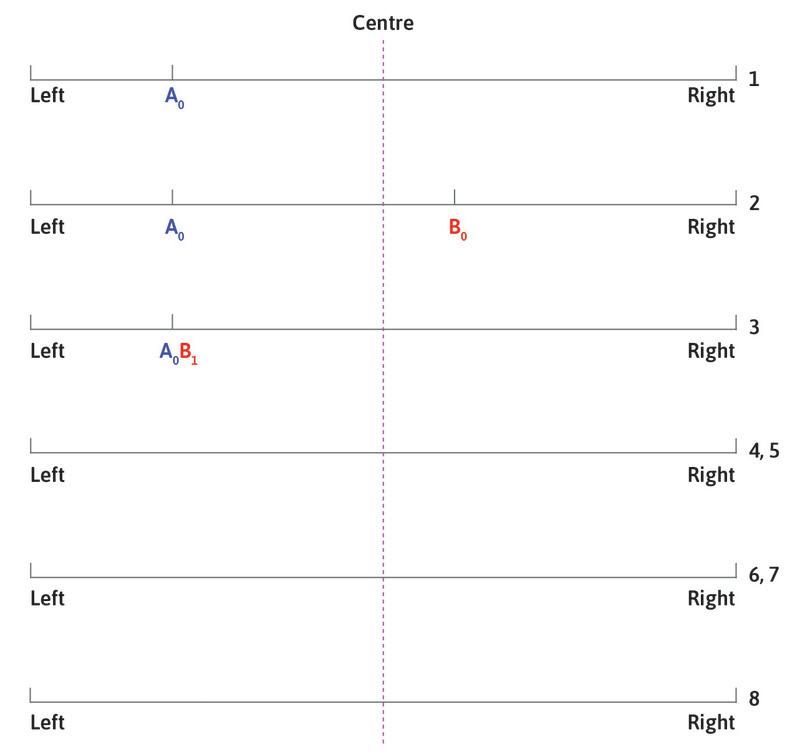
Bob realizes he could expand his sales by shifting to the left towards April, to point B1.
Figure 22.11c Bob realizes he could expand his sales by shifting to the left towards April, to point B1.
April responds …
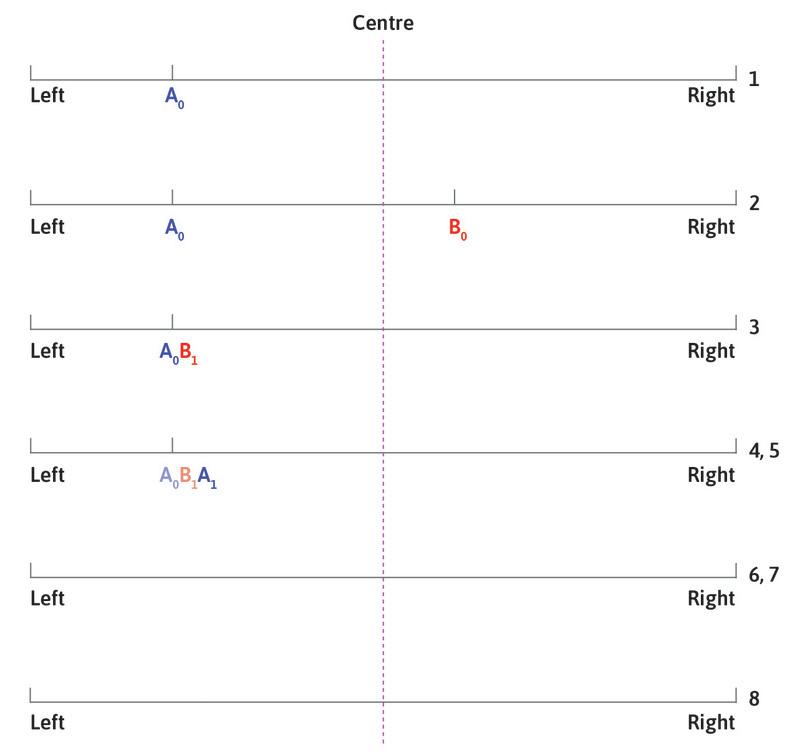
Because her customer base has shrunk, she shifts immediately to the right-hand side of Bob, B1.
Figure 22.11d Because her customer base has shrunk, she shifts immediately to the right-hand side of Bob, B1.
… and Bob responds again …
But then Bob will do the same.
Figure 22.11e But then Bob will do the same.
The two sellers keep leap-frogging
They will keep leap-frogging over each other until they are ‘back-to-back’ in the middle of the beach.
Figure 22.11f They will keep leap-frogging over each other until they are ‘back-to-back’ in the middle of the beach.

The middle of the beach
At this point, neither has an incentive to move as they have divided the customers exactly in half. This is a Nash equilibrium under the rules of the game we have set out.
Figure 22.11g At this point, neither has an incentive to move as they have divided the customers exactly in half. This is a Nash equilibrium under the rules of the game we have set out.
A parallel with politics
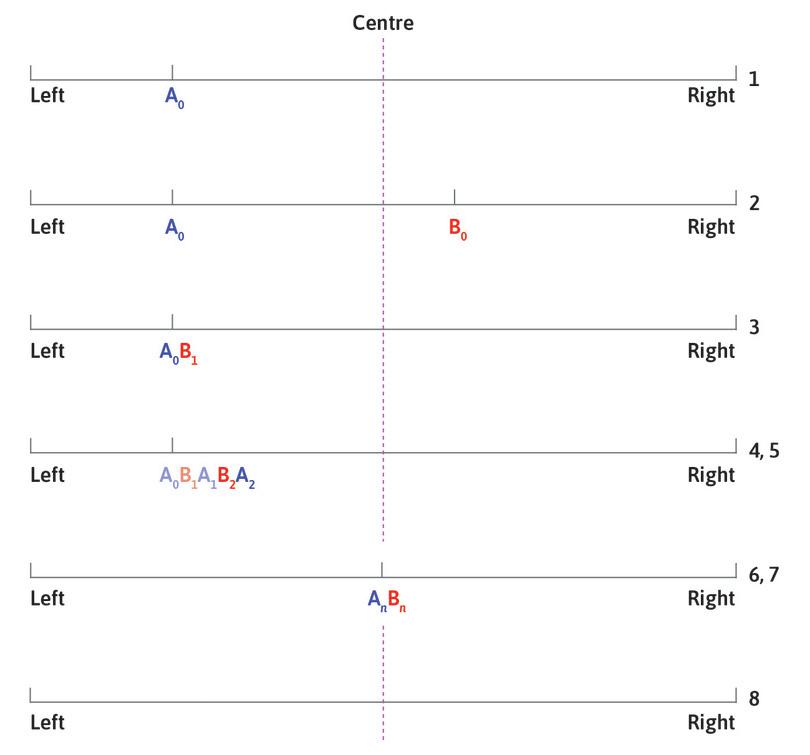
Imagine that the bathers on the far-left part of the beach are not going to buy ice cream under any condition (they are like the citizens who do not vote). Then April and Bob will locate in the centre of those who do vote at points An′ and Bn′.
Figure 22.11h Imagine that the bathers on the far-left part of the beach are not going to buy ice cream under any condition (they are like the citizens who do not vote). Then April and Bob will locate in the centre of those who do vote at points An′ and Bn′.
Along comes Bob, a second seller who is identical in economic respects to April. Where will he locate in order to maximize his sales, and hence his profits? He might reason that the market to the right of April is larger than the market to the left, so he will locate in the middle of the stretch of beach to the right of April, at point B₀. He would then get all of the bathers to his right and as well as of those to his left who are closer to him than to April.
But Bob would immediately see that he could expand sales by shifting to the left, towards April. While the customers to his right will now have to walk farther to get ice cream, they would certainly not switch to April who is even farther away. He will therefore be able to gain a few customers to his left, who were previously closest to April but are now closest to him, while losing none of those customers to his right.
How far would he go?
- Nash equilibrium
- A set of strategies, one for each player in the game, such that each player’s strategy is a best response to the strategies chosen by everyone else.
He will end up standing just to the right of April, so that he gets all of the sales along the longer stretch of beach to the right. Could Bob or April make more profits by changing their location? In other words, is this a Nash equilibrium?
It is not.
April, understanding the profit-maximizing logic that Bob has just acted on, will shift immediately to the right-hand side of Bob, to A₁. Then she will get the larger market. But then Bob will do the same, and they will keep leap-frogging over each other until they are back-to-back in the middle of the beach.
At this point, neither has an incentive to move as they have divided the customers exactly in half. Both locating halfway along the beach is a Nash equilibrium under the rules of the game. The bathers located near to the centre of the beach benefit from this. Their trip to the ice cream stand is shorter than those on the extreme left or right of the beach.
To return to politics, we can think of voters as arranged along a left-to-right spectrum much as the customers are arranged on a beach. If there are two parties competing for votes, and voters will always vote for whichever party offers policies that are closest to their views, the model tells us that the only Nash equilibrium would be for both parties to propose policies in the middle of the left-right spectrum.
On this basis, we would expect to see that voters in the middle of the left-right political spectrum would be offered two party platforms very much to their liking. Those more distant from the centre would have to choose between two platforms. One would be a little better than the other, but they wouldn’t like either platform very much.
- median voter model
- An economic model of the location of businesses applied to the positions taken in electoral platforms when two parties compete that provides conditions under which, in order to maximize the number of votes they will receive, the parties will adopt positions that appeal to the median voter. See also: median voter.
The citizen in the centre—called the median voter—has two advantages. First, she gets to choose between two platforms very close to her preferences.
Second, she is a ‘swing voter’. To understand why this is the case, consider a family on the far right of the beach. If the family choose to move slightly to the left, would this affect the Nash equilibrium position of the ice cream stands? Provided that half of the customers are to Bob’s right and half are to his left, he would gain nothing by relocating, because half the customers would still be closest to him, and half would still be closest to April. By contrast, if a family who were previously slightly to Bob’s right moved to the left, they would be likely to end up closer to April than to Bob. April would now have more customers than Bob, and Bob would want to relocate to the left.
In politics, when swing voters change their political preferences just a little, by moving to the other side of the parties in the centre, the parties in the centre move too. Changes in the political preferences of other voters make a difference too, but someone distant from the centre does not make a difference to party platforms unless he changes his preferences by enough to cross the centre to the ‘other side’.
Exercise 22.6 Rock-paper-scissors politics
Suppose that April and Bob are happily selling ice cream on the beach, standing side by side, with April getting all of the customers to the left and Bob getting all of those to the right. They will remain there because this is a Nash equilibrium. But now, along comes Caitlin, a third ice cream vendor.
- Where will she stand?
- What will happen next? And then?
- Will this process ever end?
- Is there a Nash equilibrium?
- In the ‘Rock-Paper-Scissors’ game, the best response to Rock is Paper, the best response to Paper is Scissors, and the best response to Scissors is Rock. How is the situation of ‘Caitlin-April-Bob-on-the-beach’ similar to ‘Rock-Paper-Scissors’?
22.7 A more realistic model of electoral competition
The median voter model of ice cream sellers on the beach as an illustration of political competition predicts similar party platforms that reflect the median citizen’s preferences. This presents a very limited view of the competitive process. Not surprisingly, we see that parties often do not all move toward the centre, or offer identical platforms. For example, two-candidate elections in the US in 2016 and France in 2017 occurred between a nationalist, anti-immigration candidate (Donald Trump and Marine Le Pen) and a candidate who was in favour of global trade and supported tolerance to ‘outsiders’ (Hillary Clinton and Emmanuel Macron).
Recall that the model of perfect competition among firms that you studied in Unit 8 ignores many of the ways that firms actually compete (for example, advertising, innovation, or lobbying the government for favourable legislation). Similarly, the median voter model leaves a lot out. Four facts will lead us to quite different conclusions from the median voter model:
- Not everyone votes: If neither party’s platform is attractive to a voter, they may abstain, and in many countries the least well off—those who would benefit from greater public expenditure—are less likely to vote.
- Winning votes is not the only reason a party or candidate chooses a platform: It may win financial contributions from citizens, or persuade volunteers to work for the campaign.
- The leaders of political parties care about other things: Getting elected isn’t the only reason they are in politics.
- Voters are not evenly distributed: The political spectrum is not like the beach.
In our beach example from Figure 22.11, we looked at what would happen if the bathers on the furthest left of the beach were not going to buy ice cream under any circumstances (they are like the citizens who do not vote). Then April and Bob would locate in the centre of those who do vote, namely at points An′ and Bn′ to the right of the centre in the figure. If this is the way politics works, then the platforms are similar, but the advantaged voter is now not the median citizen but a voter to the right of centre.
Next, suppose that not all families will buy exactly one ice cream. Some families will buy lots of ice cream, whereas others will buy less. Where would April and Bob stand if bathers wanted to buy lots of ice cream at one end of the beach, but not the other?
Both April and Bob would locate side-by-side as before, but nearer to these ice-cream-loving families. In politics, this means that parties would move their platforms toward voters who could contribute to their election campaign. These contributions could be money, or time spent campaigning. This would lead them to locate further right, if those voters were prepared to make contributions to the party’s election funding.
The same would occur if dissatisfied citizens at one end of the political spectrum were more likely to engage in other political activities—demonstrating, or criticizing the party platforms. The desire to attract, or perhaps silence, these ‘alienated’ voters would be another magnet pulling the platforms of both parties in their direction.
But when these things happen, both parties still have similar platforms. Now suppose there is one more condition. Instead of bathers uniformly spread along our beach, there are few in the centre and most are in two groups. One is on the left, and the other on the right. To make sure as many bathers don’t have to walk too far and so are more likely to buy an ice cream, then April and Bob would choose to move away from the centre to be closer to the distant potential buyers on the left or right.
Politics is very different from selling ice cream for another reason. As well as wanting to win elections, party leaders typically do care about the platform. They would be willing to risk losing voters at one end of the political continuum to take a position more in line with their personal values.
The ‘bathers on the beach’ model, when amended to take account of:
- the problem of voter abstention
- the importance of money and political activities beyond voting
- the fact that voters may not be evenly distributed along the political continuum
- the fact that party leaderships care about the content of their platforms
helps us understand which political platforms will be Nash equilibria in the process of political competition by means of elections.
There is, however, another important difference between elections and ice creams. April and Bob split the market and both survive, one perhaps taking slightly more of the market. In a majoritarian political system, if both parties offer similar platforms, the party that gets just one vote more than the other forms the government. The winner appoints all of the government ministers, for example, not just 51% of them.
Great economists Albert O. Hirschman
Albert Hirschman (1915–2012) lived an extraordinary life. Born in Berlin in 1915, he fled to Paris in 1933 after Adolf Hitler won power in Germany, and joined the French Resistance in 1939, helping many artists and intellectuals to escape from the Nazis. He migrated to the US in 1941.
Given this history, it’s hardly surprising that Hirschman’s career as an economist did not follow a conventional path. He crossed disciplinary boundaries with ease, grappled with questions that lay well outside the professional mainstream, and developed ideas that were imaginative, profound, and enduring.
Among Hirschman’s many influential contributions, he is best known for the thesis laid out in his 1970 book Exit, Voice and Loyalty. He was concerned with how the performance of entities such as firms and governments could be improved.11
He identified two forces—exit and voice—that could serve to alert an organization that it was facing decline and provide incentives for recovery. ‘Exit’ refers to the departure of a firm’s customers to a competitor. And ‘voice’ refers to protest, the tendency of disappointed customers to ‘kick up a fuss’. When a company performs poorly or unethically, shareholders can sell their shares (exit) or campaign for a change of management (voice).
Hirschman observed that economists had traditionally extolled the virtues of exit (competition), while neglecting the operation of voice. They favoured exit-based policies, for example those that made it easier for parents to choose which school their children attended so that schools would have to compete to enroll students.
He considered this an omission, because voice could allow a lapse to be reversed at little cost (parents could usefully seek changes in school policies, in this example), while exit might waste physical capital and human capabilities. Also, exit is not an option in some case, for example tax administration, so the free exercise of voice is critical to good performance.
After making this distinction, Hirschman explored how exit and voice interact. If exit was too readily available, voice would have little time to act. A repairable lapse could end up being fatal to an organization. This effect would be even stronger if those most sensitive to performance decline were also the fastest to exit. As he put it, the ‘rapid exit of the highly quality conscious customers … paralyzes voice by depriving it of its principal agents.’
The fact that easy exit undermines voice has some paradoxical implications. A monopolistic firm might welcome a modest amount of competition, allowing it to get rid of its more ‘troublesome’ customers. A national railway system might perform better if roads were poor, so that angry customers could not easily exit, and would work to improve it instead. And the availability of private school options might result in worse public school performance if the most quality-conscious parents took their children out of the system.
The interplay between exit and voice works through a third factor, which Hirschman called loyalty. Attachment to an organization is a psychological barrier to desertion. By slowing exit, loyalty can create the space needed for voice to do its work. But loyalty can hinder performance too if it becomes blind allegiance, because that stifles both exit and voice. Organizations may promote loyalty for precisely this reason. But if they are too effective repressing exit and voice, they would ‘deprive themselves of both recuperation mechanisms’.
Hirschman was deeply critical of the claim that, in a two-party system, both parties would adopt similar platforms that reflected the preferences of the median voter. This claim relies on reasoning that accounts for exit and neglects voice. Voters on the extreme fringes of a political party had no viable exit option, Hirschman agreed, but he rejected the implication that such a voter was powerless:
True, he cannot exit … but just because of that he … will be maximally motivated to bring all sorts of potential influence into play so as to keep … the party from doing things that are highly obnoxious to him … “[T]hose who have nowhere else to go” are not powerless but influential.
For further reading on Albert Hirschman, see these blogs by Rajiv Sethi:
- Rajiv Sethi. 2010. ‘The Astonishing Voice of Albert Hirschman’. Updated April 7 2010.
- Rajiv Sethi. 2011. ‘The Self-Subversion of Albert Hirschman’. Updated April 7 2011.
- Rajiv Sethi. 2013. ‘Albert Hirschman and the Happiness of Pursuit’. Updated 24 March 2013.
Albert Hirschman loved to play with language. English was the fourth language in which he gained fluency (after German, French, and Italian) but he still managed to coin the most wonderful expressions. He invented palindromes (words like ‘eve’ that read the same backwards as forwards) as a hobby, and presented a collection of these—using the title Senile Lines by Dr. Awkward—to his daughter Katya as a birthday gift. The right to ‘life, liberty and the pursuit of happiness’ in the US Declaration of Independence was his inspiration for the memorable phrase ‘the happiness of pursuit’, by which he meant the joy of engaging in collective action. Hirschman’s own playful exercise of voice was itself a demonstration that people often act not simply to get something, but also to be someone.
Accountability through political and economic competition: Summing up
At the beginning of this unit we considered how a natural monopoly might be run if it were in private or government hands, contrasting two ways that power in the hands of the monopolist or the government official can be made accountable. The key idea is that customers facing a monopoly are not powerless. They have the option to buy less, or even not at all. Citizens facing a government-owned firm similarly have ways of fighting back against inadequate service, by seeking to replace the government in an election.
The models we have studied have clarifed the similarities and differences between the profit-maximizing behaviour of a monopoly firm and the political-rent-maximizing behaviour of a governing elite. These are summarized in Figure 22.12, along with the ways in which each provides some combination of what Albert Hirschman called ‘exit’ and ‘voice’ as a way to make power accountable to those affected.
In the table, we represent ‘ideal democracy’ in the ‘government as monopolist model’ with a situation where the duration curve is flat (similar to the firm in a perfectly competitive market facing a flat demand curve). This means that any governing elite that sought to skim off any rents at all would be removed from office at the end of the year, just as any firm charging a higher price than the competing firms would lose all of its customers at once, and go out of business.
| Varieties of political and economic competition | Demand/duration curve | Accountability (exit/voice) | Price/tax and cost | Profits/rents | Comment |
|---|---|---|---|---|---|
| Limited political competition (dictator) | Steep | None | T > C | Political rents > 0 | ‘Govt. as monopolist’ |
| Limited economic competition (monopoly) | Steep | Limited exit | P > MC | Economic profits > 0 | Unit 7 |
| Ideal democracy (competition among parties) | Flat | Voice and exit | T = C | Political rents = 0 | Section 22.3 |
| ‘Perfect competition’ among firms | Flat | Exit | P = MC | Economic profits = 0 | Units 8 & 11 |
Comparison between models of monopolistic and competitive firms and governments. Notation: T = total taxes raised in a year; C = cost of providing the public good for a year; P = price of the good; MC = marginal cost of the good.
Figure 22.12 Comparison between models of monopolistic and competitive firms and governments. Notation: T = total taxes raised in a year; C = cost of providing the public good for a year; P = price of the good; MC = marginal cost of the good.
Exercise 22.7 Nash equilibria in the median voter model
Would locating at the middle of the beach still be a Nash equilibrium in the following cases? In each case, explain the political analogy to the ice cream seller example.
- Suppose people will not walk very far to get their ice cream.
- Suppose instead of being spread evenly along the beach, there was a concentration of bathers at each end.
- Suppose the bathers are evenly spread along the beach, but those at the left end of the beach will not walk very far to purchase ice cream, while those at the right end of the beach will surely purchase a cone, no matter what the distance.
Question 22.3 Choose the correct answer(s)
Consider Figure 22.11. Which of the following statements are true?
- False. Bob is the closest stall for more than half of the customers.
- True. April will attract all of the customers to the right of their position, which is clearly more than half of the total customers.
- False. Both April and Bob will still be the closest stall for exactly half of the customers. If they move anywhere else, they will reduce the number of customers they attract.
- True. April and Bob care only about maximizing sales and therefore they ignore any individuals who won’t buy ice cream when determining their position on the beach.
22.8 The advance of democracy
Social unrest and universal suffrage
By extending the model of the government as monopolist to include political competition, we have a framework for understanding the emergence of representative institutions and eventually universal suffrage, as described at the beginning of this unit. Governments survived if they provided citizens with essential public services at reasonable tax rates, rather than through palace intrigues or the threat of force.
For example, in the US, the school committee in the textile city of Lowell, Massachusetts advocated an expansion of free public education in its 1846 Annual Report with these words: ‘Let then the influence of our Common Schools become universal; for they are … our surest safety against internal commotions.’
Fear of instability that prompted some of the wealthy in the US and elsewhere to advocate greater democracy also helped spread democracy (in Figure 22.13). As you saw in Figure 19.2, inequality grew in the years following the capitalist revolution in the countries for which we have data. During this period, farmers, industrial workers, and the poor demanded greater political equality—and especially the right to vote—as a means of gaining a larger share of the output and wealth of the rapidly growing economies. In 1848 there were attempted revolutions against the monarchy in Sicily, France, Germany, Italy, and the Austrian Empire. At the same time, Karl Marx was writing The Communist Manifesto. One of the revolutionary leaders, James Bronterre O’Brien, told the people:
Knaves will tell you that it is because you have no property, you are unrepresented. I tell you on the contrary, it is because you are unrepresented that you have no property …12
Gaining political power according to O’Brien was the route to gaining a larger slice of the economic pie, not the other way around.
In the late nineteenth and early twentieth century the wealthy in many countries concluded that extending democracy might be prudent, much as the leaders of the South African government were to conclude a century later.
Figure 22.13 shows that democracy, as defined by all three of the characteristics (rule of law, civil liberties, and inclusive fair elections), is a recent arrival in human history.
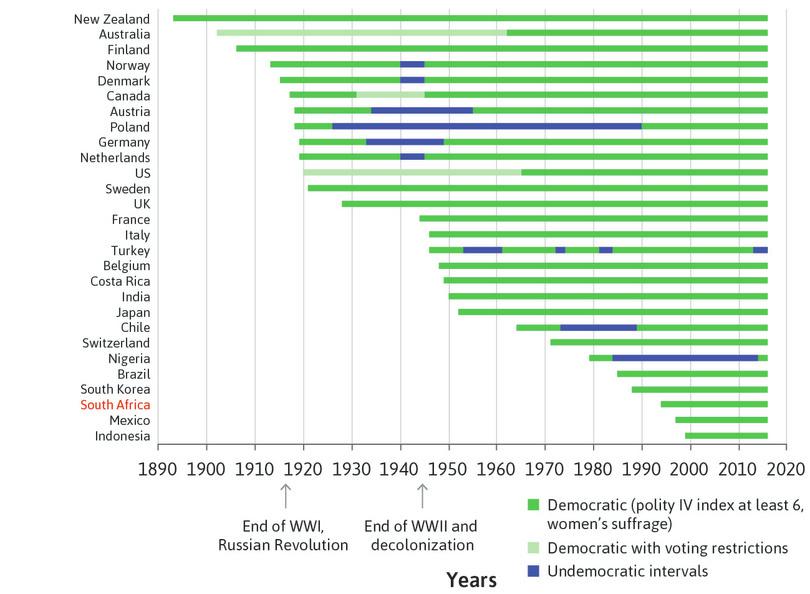
The advance of democracy in the world.
Figure 22.13 The advance of democracy in the world.
Center for Systemic Peace. 2016. Polity IV annual time series ; Inter-parliamentary union. 2016. ‘Women’s Suffrage’. Initial periods of democracy of less than five years are not shown in the chart.
The first democratic nation was New Zealand, which became fully democratic just before the turn of the twentieth century, although it remained a British colony until 1907. At that time elections were held in many countries but women, those without property, or other disadvantaged groups were denied the right to vote.
South Africa, Mexico and some of the countries once ruled by the Communist Party (Poland, for example) are relatively recent additions to the club of democratic nations. Switzerland is also a recent addition. By the time that Swiss women finally won the right to vote in 1971, the prime ministers of Sri Lanka, India, and Israel were all women. Universal male suffrage in Switzerland had been granted 90 years earlier. If universal male suffrage were considered sufficient for an ‘inclusive’ election, then Switzerland and France (1848) would have been the first democracies, but the exclusion of major population groups means that elections are not inclusive, and so they fail our test.
Excluding women from voting makes a difference in the policies that elected governemnts adopt. The feature in the next section, ‘Women’s suffrage and the reduction in child mortality in the US’, shows that excluding women from the vote had significant effects on government policies, and also on the wellbeing of citizens.
The US enfranchised women in 1920 but had denied the vote to black people in many states before 1965. We indicate the complicated status of the US using a light green bar. We have done the same for Australia, where indigenous Australians were denied the right to vote before 1962, and for Canada, which restricted the voting rights of Native Americans for a brief period.
The world’s most populous democracy (by far) is India, since it gained independence from the UK in 1947. The most populous country that is not a democracy is (also by far) China.
Notice in the figure the two waves of countries that became democratic. The first wave occurred at the time of the First World War and the Russian Revolution, which tripled the number of democracies in the world in less than 10 years. The First World War provided much of the impetus for the spread of democracy during this first wave.
If you look at the figure, you will see that the US was not democratic at this time, because the right to vote was restricted to men. The other winning countries in the First World War (France and the UK) were not democracies either at the time. In both countries, women and those without property were denied the right to vote.
A second wave of democracies emerged after the Second World War. Many former colonies, including India and Indonesia, became democratic at this time.
The extension of suffrage in the early years of the twentieth century made many countries in northern Europe and New Zealand into democracies. In those countries, the rule of law and civil liberties—the other two criteria for a democratic political system—had been in force long before the introduction of universal suffrage.
After the Second World War, most countries had already granted the right to vote to virtually all adults (though in Saudi Arabia, for example, women gained voting rights only in 2015). Today, countries judged to be undemocratic (such as Russia) often do not fail our test because of restrictions on the electorate. They are not democracies because the rule of law and civil liberties are inadequate.
The blue patches in the bars show that there have been some interruptions in democracy, including the period of dictatorship in Chile following the military overthrow of the democratic government, and the period of Fascist rule in Germany between 1933 and 1945, but most countries that have become democratic have continued to be democracies.
All the countries in the figure can be decribed as democratic because they are sufficiently close to the criteria we have laid out. But in some cases, there is a large difference between our three criteria of rule of law, civil liberties, and inclusive fair elections, and how the system functions in practice. In the US for example:
- In 2000 and 2016, the winner of the presidential election received fewer votes than his opponent.
- Private contributions from wealthy individuals and groups play a major part in the financing of political campaigns (see the feature ‘Does money talk?’ in Section 22.14 to see how this may undermine the democratic value of political equality).
Spending priorities in a democracy
Joseph Schumpeter (see Section 2.5) once wrote that the public budget is the ‘skeleton of the state stripped of all misleading ideologies’. He argued that the way in which a government spends its money reveals its true priorities, much in the way that an individual’s spending pattern is a lens through which to study his or her preferences.
Joseph Schumpeter. 1918. ‘The crisis of the tax state.’ Reproduced in Swedberg R. (ed.) 1991. Joseph A. Schumpeter, The Economics and Sociology of Capitalism. Princeton University Press.
As we have seen, before the twentieth century a major activity of governments was defence (in some cases, predation on other nations), and raising the taxation to support it. But well before that time, some ruling institutions came to understand that they would benefit from providing conditions for the growth of the economy—building canals, roads and schools in the nineteenth century, for example. Economic development could be an asset either by creating a larger tax base, a more scientifically oriented cadre of citizens, or by building financial institutions that could loan money to the government.
During the twentieth century large-scale production in firms was easy for the govenment to see, and happened in one place. This made taxation and regulation of firms easier, and governments could also use the accounting books and payroll records of firms to find out who was paid what. This meant that taxing individuals became easier too. Governments in many countries deducted tax directly from the pay of their citizens, and many workers were taxed explicitly for ‘social security’, that is, to fund pensions and sometimes healthcare.
The 2010 Mirrlees Review offered proposals for a comprehensive reform of the UK’s tax and transfer system, addressing the scope for better addressing market failures and unfairness.
Changes in the structure of the economy also made it easier for governments to levy taxes, not on a specific good such salt or imports, but on consumption in general and ultimately on value added in production. These broad-based taxes play an important role in the public finances of advanced economies. With the extension of voting rights to virtually all adults, governments became accountable to their citizens for delivering services.
This historical processes of transition from political monopoly to political competition have produced most of the modern governments in the world, with their distinctive patterns of spending.
Figure 22.14 shows how the democratic governments of the US, South Korea, and Finland spend their money.
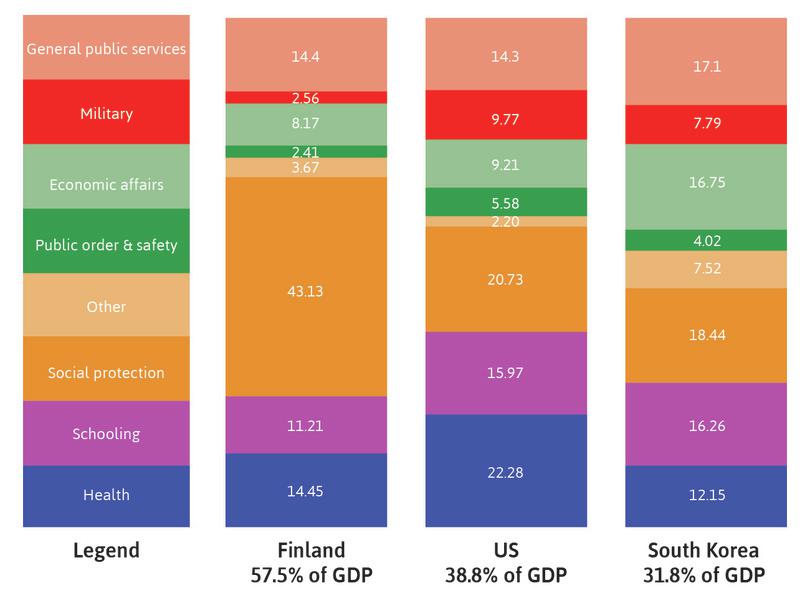
Patterns of public expenditure in Finland, the US, and South Korea (2013).
Figure 22.14 Patterns of public expenditure in Finland, the US, and South Korea (2013).
OECD. 2015. ‘Government at a Glance’. This dataset takes data from OECD National Accounts Statistics and from Eurostat government finance statistics.
The size of the government of Finland’s expenditure is 57.5% of its GDP, which is the largest among the three countries. For the US, it is 38.8%. Note: this does not mean that the US spends less than Finland in absolute terms, just that government expenditure is a smaller fraction of the country’s GDP. Expenditure by South Korea’s government is 31.8% of its GDP.
This is what the categories mean:
- social insurance
- Expenditure by the government, financed by taxation, which provides protection against various economic risks (for example, loss of income due to sickness, or unemployment) and enables people to smooth incomes throughout their lifetime. See also: co-insurance.
- Public services: These include funds for running parliament, congress, local councils, also foreign aid and public debt transactions.
- Military: As previously stated, one of the motivations for government has been for protection or to wage war.
- Economic affairs: This includes expenditures on infrastructure such as roads, bridges, and the Internet.
- Public order and safety: This includes police, fire, prison services, and law courts.
- Social protection: We discussed the social insurance spending that a government might make in Unit 19, and those are labelled ‘Social protection’ in the figure.
- Schooling: All governments are responsible for at least some education provision.
- Health: This includes medical equipment, hospital and outpatient services, and public health.
There are many reasons why governments differ in their spending patterns. One reason is that political institutions differ, even among democracies.
Exercise 22.8 Past influences on current government spending patterns
How would you characterize the two biggest differences in the pattern of spending between the three pairs of countries (the US vs South Korea, the US vs Finland, and Finland vs South Korea)?
Can you think of differences in the countries and their histories that might account for these differences? You will need to do some research to support your claims.
Exercise 22.9 Comparing government expenditures
Go to the source of Figure 22.14, OECD statistics, and see if you can find different countries for each of the following criteria (for the year 2015, or the most recent year available).
- General government expenditure (as a percentage of GDP) is greater than South Korea’s, but less than Finland’s.
- Government expenditure on health (as a percentage of GDP) is greater than the US’s.
- Government expenditure on social protection (as a percentage of GDP) is greater than Finland’s.
- Government expenditure on defence (as a percentage of GDP) is greater than South Korea’s.
22.9 Varieties of democracy
In Unit 1, we defined capitalism as an economic system and pointed to the important differences among capitalist economies, in terms of the extent of government involvement and the degree of inequality in the economy. Democracy as a set of political institutions (a political system) comes in many varieties, too.
Accountability and transfers of power
The conditions under which one government leaves office and is replaced by another illustrate the varieties of democracy. There are two principles that are essential to democratic government:
- democratic accountability
- Political accountability by means of elections and other democratic processes. See also: accountability, political accountability.
- Democratic accountability: A governing party that is not serving the interests of a majority of its citizens will lose an election and must leave office. Democratic accountability ensures that citizens, through their right to vote, can remove government that they think is performing poorly and replace it with one more to their liking.
- No non-electoral transfer of power: Removal from office is (with rare exceptions) the result of losing an election rather than a military coup, assassination, breakdown of social order, or impasse in the process of government.
You have already seen these two principles in the model of the government presented earlier in this unit. In the model, democratic accountability was represented by a flatter duration curve, as there was a greater likelihood that the government would be dismissed if it were collecting large political rents.
Countries differ considerably along these two dimensions (Figure 22.15). Many conform closely to both. Some barely conform to either and their status as a democracy is contested.
- Singapore: An example of extraordinary political stability where the likelihood of transfer of power by any means other than an election appears very small. Yet in more than 50 years there has not been a single electoral transfer of power. The same political party has ruled over the city-state since 1959. This remarkable political durability is undoubtedly in part due to the fact that living standards in Singapore have increased rapidly. But if citizens were to seek a transfer of power to a different party, the lack of press freedom, and other undemocratic practices of the ruling party, would make it difficult to do so.
- Italy: Without question a democratic nation, Italy struggles to meet the second principle. Governments that disappoint voters are regularly replaced. But governments are also replaced as a result of parliamentary disputes and the intervention of the president, who can dissolve the parliament.
- Pakistan: An example of a country in which democracy is not strong in either dimension. The governments of Pakistan have been notoriously unresponsive to the concerns of the electorate, and non-electoral transfers of power in Pakistan have included three successful military takeovers.
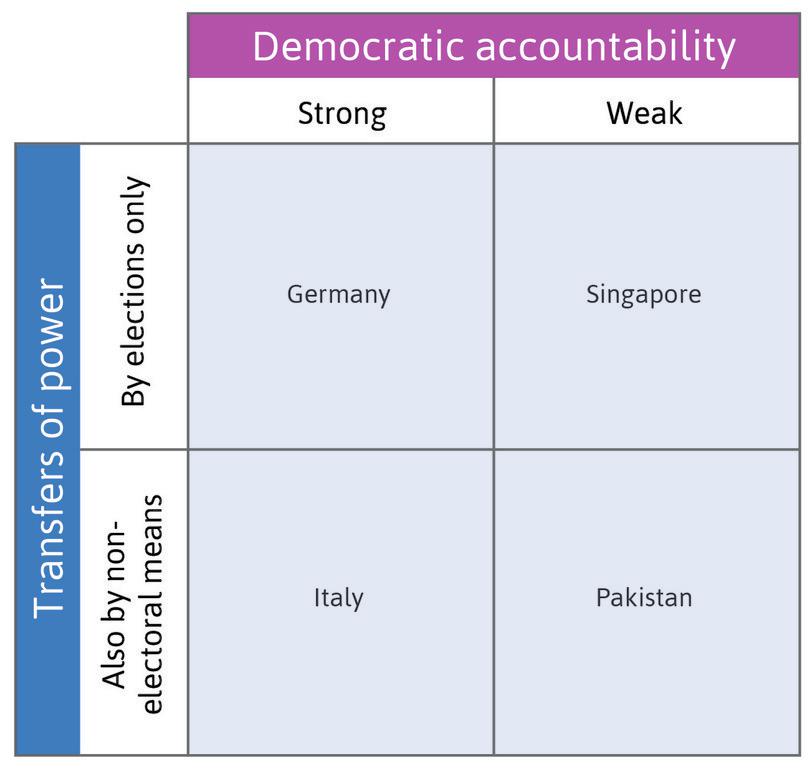
Democratic accountability and transfers of power.
Figure 22.15 Democratic accountability and transfers of power.
Exercise 22.10 How democracy helps protect the governed
In 1943 there was a famine in West Bengal, India, while the country was under colonial rule from the UK. At least 2 million people died as a result. Amartya Sen, an economist who won the Nobel Prize, said that: ‘No famine has taken place in the history of the world in a functioning democracy.’
- What defining features of a democracy might account for this?
- How would colonial rule by a foreign power differ from democracy?
- How might these differences help explain why the 1943 famine occurred, and why no famine has occurred since the transition from colonial to democratic rule?
- Read this article, and re-read the introduction to Unit 2 about the Irish famine. Explain how economic thinking at the time may have contributed to the limited response of the British colonial government to famine during that period.
22.10 Democracy makes a difference
Our model of the government also allows us to understand the impact of one of the major developments in twentieth-century economics and politics: the extension of voting rights to virtually all adults. In consequence, governments have increasingly devoted tax revenues to public services and other expenditures that differentially helped the poor. As we saw in Unit 19, the result has been that people have acquired more of their wellbeing by right, as a citizen, rather than purchasing it as a marketed good or service.
The growth of various forms of social insurance is a big part of the two steps up in the size of the government that you saw in the UK in Figure 22.2, the first taking place after the extension of the suffrage in 1928, and the second in the aftermath of the Second World War.
Friedrich Hayek warned in his book Road to Serfdom that the growing size of government would undermine democracy and the rule of law, pointing to the experience of Germany under fascism and Russia under communism.13 This does not appear to be the case in general: the countries ranked highest on measures of rule of law—Norway, Finland, Sweden, Denmark, and the Netherlands—all are notable for their high levels of government tax revenues as a fraction of GDP. The US and the UK, with a smaller government, are ranked lower.14 15
But this correlation does not show that a larger government promotes the rule of law and democracy. The most that can be said is that longstanding democracy, rule of law, and a large government (relative to the size of the economy) can coexist.
How economists learn from facts Women’s suffrage and the reduction in child mortality in the US
Recall James Bronterre O’Brien who, when campaigning against property ownership as a requirement for voting in nineteenth century Britain, wrote: ‘Because you are unrepresented … you have no property’.
But does getting the right to vote increase the wealth and wellbeing of groups previously excluded from voting?
This is not a simple question to answer. Consider South Africa. Throughout its history prior to 1994, people of non-European origin were denied the right to vote, but they were also discriminated against by employers, landlords, schools, and medical institutions. Were the racial disparities in wealth, health, and other dimensions of wellbeing in that country a result of race restrictions on democratic political rights?
In behavioural experiments and in other evidence, women on average place a higher value on child welfare and public services. In that case, we would expect that public policy would change when women got the vote.
A natural experiment to assess the importance of voting rights is women’s suffrage in the US, because voting laws differ by state. As a result, women gained the right to vote at different times, starting from 1869 in Wyoming. In 1920, an amendment to the US Constitution granted the vote to women in all states. Grant Miller used information on when women got the right to vote to do a before-after comparison on actions taken by elected officials, public expenditures related to child health, and health outcomes for children.16
Miller chose to focus on child healthcare policies because women had campaigned to expand health services for children, and it is reasonable to say that women’s preferences differed from men’s on these issues. But during the nineteenth century and before, those justifying voting restrictions claimed that women had a kind of ‘virtual representation’ through their husbands or fathers. Even the household servants of the rich were said to be virtually represented by their employers.
The logic of the natural experiment is shown below, with each of the arrows representing possible causes that Miller explored:

![]()
Here is what Miller found:
- Looking state-by-state at the date women got the right to vote, enfranchisement had no apparent effects on state public spending in other areas, but it boosted social service spending by 24%. At the federal government level, within a year of the passage of the Nineteenth Amendment, the US Congress voted a substantial increase in public health spending, especially aimed at children. A historian of the legislation concluded that ‘the principal force moving Congress was fear of being punished at the polls … by women voters.’
- The deaths of children under the age of nine fell by somewhere between 8% and 15%, primarily as a result of drops in the kinds of diseases related to the public programs that had been adopted, especially large-scale door-to-door hygiene campaigns. To put these numbers in perspective, in 1900 one in five children did not live to the age of five. The passage of healthcare programs prevented an estimated 20,000 child deaths per year.
These effects were possible because of the nineteenth-century revolution in scientific knowledge of bacteria and disease, advances that had yet to be brought to the public in improved health. Women’s suffrage helped to do this.
Miller’s research shows that a big change in public policy resulted when women in the US were directly represented. This is why for Switzerland, where men got the right to vote earlier than any other nation, we nonetheless dated democracy from 1971, the time that women got the vote (Figure 22.10), because who can vote matters.
Other than an increase in the size of government, are there other effects of the advance of democracy on the functioning of the economy? The experience of many countries suggests a positive answer. For example, the golden age of capitalism (the three decades following the Second World War) was the first period in which all of the major economies were governed by democracies.17
While it seems reasonable that democracy was partly behind these success stories, for example through greater political stability, it is impossible to establish democracy as the only or main cause. Too many other things changed at the same time that might account for the economic changes.
The countries that took the lead in advancing political equality have a different balance now between work time and free time, as Figure 22.16 shows. This is not surprising, given that the reduction in working hours over the past 100 years was not simply a matter of individuals choosing shorter workdays. As we saw in Unit 3, it was also the result of political parties (especially after the extension of the vote to workers) seeking legislation to limit the number of hours a person could be asked to work without additional pay.
The duration of democracy and working hours (2014).
Figure 22.16 The duration of democracy and working hours (2014).
But the countries with the fewest work hours in 2014 and the highest number of years of democracy (Denmark, Sweden, and the Netherlands) had longer work hours at the time they became democracies than the average of other countries for which we have data. This is evidence to support the case that democracy had an effect on work hours.
Figure 22.17 shows that countries that were the first to give the vote to all—Finland, Norway, Sweden, Denmark, and the Netherlands—today have more equal disposable incomes than countries with a shorter experience of this kind of political equality. In many cases, reduced inequality in disposable income was the result of government programs that benefited poorer voters (women and workers, for example) who had previously been excluded from voting (as we have seen in Figures 19.1 and 5.16).
The duration of democracy and inequality in disposable income (2015).
Figure 22.17 The duration of democracy and inequality in disposable income (2015).
Cross National Data Center. LIS Database. Household market (labour and capital) income and disposable income are equivalized and top- and bottom-coded.
Exercise 22.11 Work times and inequality in less democratic democracies
Redraw Figure 22.16 and 22.17 using a different definition of democracy, over the same period as in Figure 22.13 (1890–2015). For example, allow a country to be ‘democratic’ even if women and some ethnic minorities were excluded from voting (you already know that this will affect the duration of democracy of Australia, US, Canada, Switzerland, and France). You can download the Polity IV dataset that was used to create Figure 22.13, and consider a polity score of 6 or above as democratic. The data on working hours and inequality are shown below.
Country Average hours worked (2014) Disposable income Gini Australia 1,803 0.330 Denmark 1,438 0.247 Germany 1,371 0.287 Netherlands 1,420 0.254 US 1,765 0.390 Sweden 1,609 0.236 UK 1,675 0.335 France 1,474 0.288 Italy 1,734 0.327 Belgium 1,575 0.282 Canada 1,688 0.317 Switzerland 1,568 0.291 Finland 1,643 0.262 Norway 1,427 0.244 Austria 1,629 0.268 Brazil 1,711 0.462 South Korea 2,124 0.310 India 2,162 0.502 Japan 1,729 0.302 Poland 2,039 0.307 South Africa 2,215 0.605 Mexico 2,137 0.437 Would you reach a different conclusion about how democracy is statistically related to the following, under this alternative, less strict, definition of democracy?
- work time
- inequality
22.11 A puzzle: The persistence of unfairness and market failures in democracies
Contemporary South Africa is just one example of a society in which there are opportunities for mutual gain that are not exploited—for example, More than one-quarter of the labour force are unemployed. And it is widely held—even by many well-off South Africans—that the distribution of the economy’s burdens and benefits is still grossly unfair.
The previous units have shown similar cases in which economic outcomes are Pareto inefficient, so potential mutual gains remain unrealized, as the summary table in Figure 12.8 showed. Figure 22.3 listed policies aimed at addressing inefficiency and perceived unfairness. And we know that citizens in many countries think the distribution of wealth or income is unfair.
This is a puzzle. If government action could realize potential gains, and the citizens in a democracy would prefer that it did, why do these inefficiencies persist in a democratic society with a capitalist economy? The short answer is that just as markets fail, so too do governments.
Government failure
Fixing some problem of Pareto inefficiency or perceived unfairness will happen only if:
- It is economically feasible: The policy to fix the problem, if implemented, must work.
- It is administratively feasible: The government must have the capacity to implement the policy.
- Special interests allow it: Those who control government policy must want to see the policy implemented.
Economic infeasibility
- economically feasible
- Policies for which the desired outcomes are a Nash equilibrium, so that once implemented private economic actors will not undo the desired effects.
Given people’s preferences and the information available to private economic actors, there may not be a feasible set of policies that would sustain an efficient and fair outcome. For a policy to have economic feasibility, it must be a Nash equilibrium, which means no actor can improve its position by changing its behaviour.
For example, a government that tried to enforce perfect competition in every industry would fail. Since firms are free to advertise, and to differentiate their products, it is impossible for the policymaker to legislate that demand curves be horizontal. We have also seen that no macroeconomic policy can entirely eliminate unemployment, given that the threat of unemployment motivates people to work hard and well.
Administrative infeasibility
- administratively feasible
- Policies for which the government has sufficient information and staff for implementation.
Even if there is an economically feasible policy that would address a problem if it were adopted and implemented, this may be impossible in practice due to the limited information and capabilities of government officials, which means it lacks administrative feasibility. By failing to understand the incentives of the relevant economic actors or other aspects of the problem, policies adopted by the government may be ill-suited to the objectives of all the actors. So governments may lack the capacity to collect tax revenue efficiently and honestly, to enforce its policies through the judiciary (including anti-monopoly policy), and to deliver public services such as schooling and health.
Special interests
Even if a policy is economically feasible (a Nash equilibrium) and could be implemented administratively, the government may choose not to adopt it because of opposition by groups (including members of the government itself) that would be harmed by the change, which would be the case if certain groups benefit from the unfairness or the inefficiency.
In the next three sections, we will consider in turn how economic infeasibility, administrative infeasibility, and special interests can prevent fair and efficient policies from being introduced.
22.12 Economic infeasibility
Many important economic actions cannot be simply enforced by the government. The government can use its powers of tax collection to provide for schools and order that all children must attend those schools until age 16. But it cannot mandate that students study hard and learn a lot, or that teachers teach effectively.
As we saw in Section 22.1, the government uses regulation and public provision, but can also provide incentives and information that are intended to lead people to act in a way consistent with its objectives. For example, the central bank can lower the interest rate at which it lends to commercial banks, with the intention of inducing them to lend to households and businesses at a lower rate, and, in this way, to stimulate spending. Or the government can impose a tax on fuel to alter the opportunity cost of driving, providing people with their own reasons to drive less.
Two examples of important but ‘difficult to command’ economic activities are investing and working hard. Governments do not have the information or the legal authority to command wealthy individuals to use their financial resources to invest in infrastructure (other than in exceptional circumstances such as wartime), or workers to work hard and well.
How policies work by shifting the Nash equilibrium
Understanding how private actors respond to public policy is essential when addressing social and economic problems. For example, the government official who imposes a tax on sugary drinks in order to reduce obesity does not control the responses of consumers. An economically feasible outcome of the tax must be based on how consumers respond if it costs more to have another soda drink. The policy needs, for example, to take account of consumers who switch from sugary drinks to other sources of sugar that have not been taxed. Economic research surveyed in Section 7.9 gives the policymaker some guidelines about how successful the policy might be in controlling diabetes through its effect on relative prices.
- ceteris paribus
- Economists often simplify analysis by setting aside things that are thought to be of less importance to the question of interest. The literal meaning of the expression is ‘other things equal’. In an economic model it means an analysis ‘holds other things constant’.
To be economically feasible, the intended outcome of the policy must be a Nash equilibrium, that is, all individuals affected are doing the best they can do, given how all other actors are acting in response to the policy. Many of the models economists use include the ceteris paribus condition, which means other things being equal. But as economists like to point out, in many important applications of economic theory, ‘ceteris ain’t paribus’. All other things aren’t ever equal before and after the policy is implemented. Checking whether a policy is economically feasible means relaxing the ceteris paribus condition to consider the full set of strategies available to actors under the new circumstances.
To understand the ways that economic feasibility constrains policymakers, consider the case of the proposal to introduce an unemployment benefit financed by a tax on profits. The aim of the policy is to improve the standard of living of the unemployed without increasing the unemployment rate.
Unintended consequences
We begin by identifying the Nash equilibrium in the initial situation before the policy is introduced. In Figure 22.18a, the economy is at the point marked N, where the wage- and price-setting curves intersect. As we confirmed in Unit 9 (Section 9.6), this is a Nash equilibrium because neither a worker (employed or unemployed) nor a firm could be better off by setting a different wage or price, offering to work at a different wage, or hiring a different number of workers.
First, we look at the short-run impact of the policy using Figure 22.18a.
- Initial situation: The Nash equilibrium is at point N.
- Voters demand a new policy: The workers—employed and unemployed—vote to elect a government that wishes to introduce an unemployment benefit that workers will receive when out of work, financed by a tax on profits.
- Short-run impact: This raises the reservation option of employed workers, shifting up the wage-setting curve, so that employers now have to pay more to induce workers to work hard and well. This is shown by point C.
The policy has its intended effect: the unemployed receive a higher income, and employed workers’ wages have risen too, seemingly an unexpected feature of the policy. However, this unintended effect, raising wages, takes the economy away from its initial Nash Equilibrium. We will see how the long-run effects can differ from the short-run effects.
Using the analysis in Figure 22.18a, follow through the logic of the model as the actors respond to the policy.
Introducing an unemployment benefit: Short- and long-run effects.
Figure 22.18a Introducing an unemployment benefit: Short- and long-run effects.
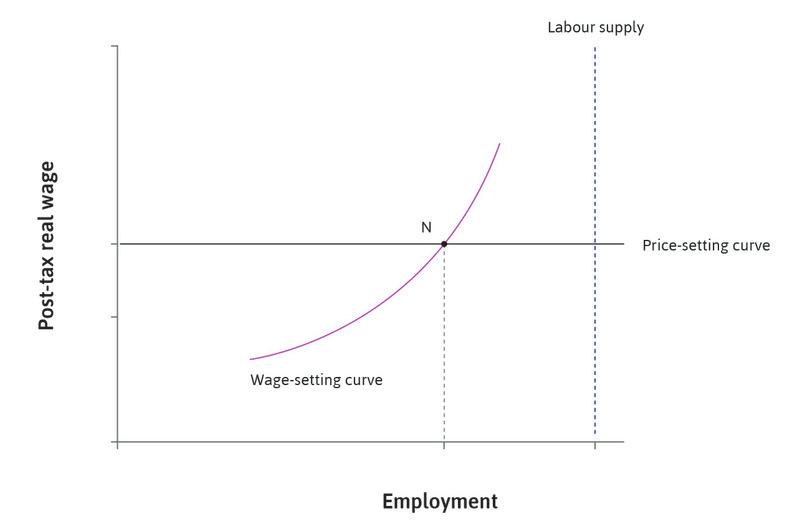
The status quo
The Nash equilibrium is at point N. The new government introduces an unemployment benefit that workers will receive when out of work, financed by a tax on profits.
Figure 22.18a-a The Nash equilibrium is at point N. The new government introduces an unemployment benefit that workers will receive when out of work, financed by a tax on profits.
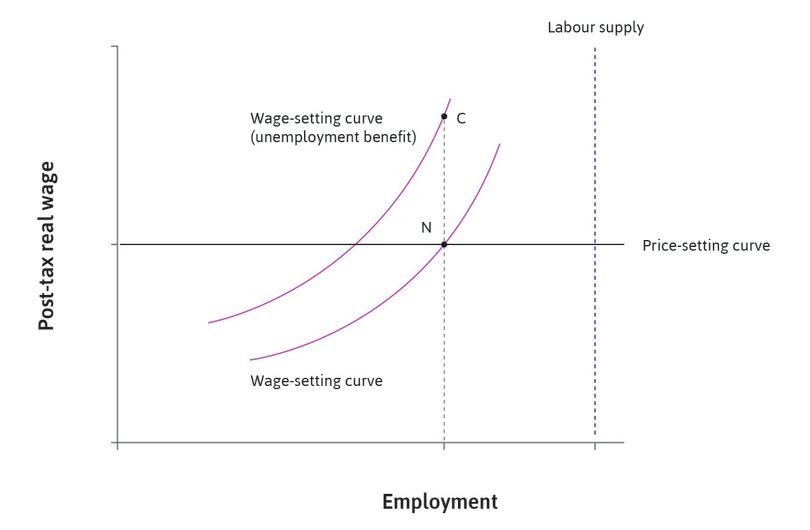
The unintended consequence
This raises the reservation option of employed workers, so that employers now have to pay more to induce workers to work hard and well. This is shown by point C.
Figure 22.18a-b This raises the reservation option of employed workers, so that employers now have to pay more to induce workers to work hard and well. This is shown by point C.
The result
The tax on profits shifts the price-setting curve downwards. The new Nash equilibrium is at N′, with higher unemployment and a lower real wage.
Figure 22.18a-c The tax on profits shifts the price-setting curve downwards. The new Nash equilibrium is at N′, with higher unemployment and a lower real wage.
What is the long-run impact of the policy? In the labour market diagram, we see that there is:
- A new Nash equilibrium: The unemployment benefit has shifted the wage-setting curve upwards. In the short-term, the labour market shifts to point C. But the tax which finances the more generous benefits has shifted the price-setting curve downwards, so in order to ensure the required profit margin for firms, the real wage must be lower.
- Firms reduce employment, or shut down: Some firms paying the new higher wage will be making insufficient profits to motivate further investment and so they will cut back employment; other firms will fail or move production to other countries.
- Long-run impact: These changes will push the economy towards point N′, where (as intended) the unemployed will now receive higher income when out of work, but fewer workers are employed and the employed workers receive a lower wage.
The policy objective—raise the living standards of the unemployed without increasing unemployment—was economically infeasible.
Yet we have seen in Unit 16, Figure 16.16 that countries with more generous unemployment benefits do not necessarily have higher unemployment rates. This suggests that these countries were able to achieve a Nash equilibrium outcome different from either N or N′. Figure 22.18b shows how this may have happened—there is a third Nash equilibrium at N″ where a new higher price-setting curve intersects the post reform wage-setting curve.
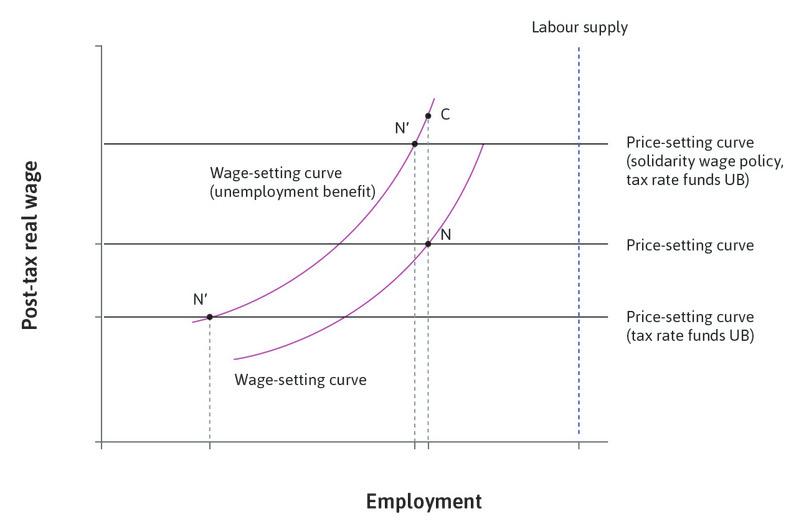
Combining the introduction of an unemployment benefit with a solidarity wage policy.
Figure 22.18b Combining the introduction of an unemployment benefit with a solidarity wage policy.
The Swedish approach had its origins in the ‘solidarity wage policy’, devised in 1951 by Gösta Rehn and Rudolph Meidner, two economists who worked at the research institute of the Trade Union Confederation in Sweden.
They reasoned that workers and employers have a common interest in rapid productivity growth, and that workers could enjoy higher wages without the profits of firms being reduced if more of the economy’s output was produced by high-productivity firms rather than in firms with low productivity.
The solidarity wage policy in Sweden was actually three linked policies:
- Equal wages for equal work: This means that the wage for each job was set at the national level by negotiations between the employers’ association and the union. This had the effect of compressing wage differences among workers doing similar jobs. The lowest-productivity firms had survived by paying lower wages to equivalent workers than other firms paid. Under the new policy, they could not pay the negotiated wage and still remain profitable, and so had to exit the industry. Higher-productivity firms survived and took over the market share of the failed firms.
- Unemployment benefits: These were generous but time-limited. See Unit 16 for more detail on how this policy works.
- Active labour market policy: Retaining and mobility allowances to displaced workers, for example, aimed to improve matching them with vacancies. It protected workers rather than jobs. Again, you can find more detail on this type of policy in Unit 16.
The tax-financed increase in unemployment benefits alone would likely have pushed the price-setting curve downwards, as in the example above. But the solidarity wage policy also forced low-productivity firms out of the market. The remaining firms had higher productivity and could therefore maintain their profit margins at lower prices, pushing the price-setting curve upwards. Retraining and mobility allowances ensured that these high-productivity firms had access to a well-trained workforce, allowing them to cut costs and prices even further. Figure 22.18b shows how this combination of policies resulted in a new equilibrium with higher real wages at N″, and without the rise in unemployment at N′.
This is an example of how a democratic political environment with large nationally oriented trade unions and a responsive government could sustain low levels of inequality (shown in Figure 22.17), while raising average living standards.
Economic feasibility: An example from Chile
The previous analysis using the labour market model is a simplification. But it helps us understand real economic forces operating in the world. Chile is one example.
In 1970, the socialist Salvador Allende was elected president of Chile in a surprise victory, on a platform promising greater public services and nationalization of many of the privately held firms in the country.
The reaction of the wealthy is seen in the stock market prices, shown in Figure 22.19. A stock (or share) is a share in the ownership of a company, and its price (as you know from Unit 11) measures how much it is worth to own part of that company and as a result receive a share of its profits, and benefit in the future from selling it to another person.
Share prices rise when, taking everything into account, owners or potential buyers of shares think that the company will be more profitable in the future. When a socialist president was elected in Chile, wealthy people were worried about higher taxes, policies favouring their employees that would mean paying them higher wages, and the possibility that the government or even workers might expropriate (take over the ownership of) the firm’s assets.
These worries created a limit to the policies that would prove economically feasible for the Allende government. If the wealthy thought that the firms they owned would be less profitable in the future, they would have no incentive to invest in increasing the assets of the firm. Rather than invest in these firms, the wealthy might then invest in another country (known as capital flight), in housing, or in other Chilean assets more likely to be valuable in the future.
As you can see from Figure 22.19, stock prices plummeted straight after Allende’s election day. We will pick up the Chile story a bit later, seeing that political interests as well as economic infeasibility can limit what a democratically elected government can do.
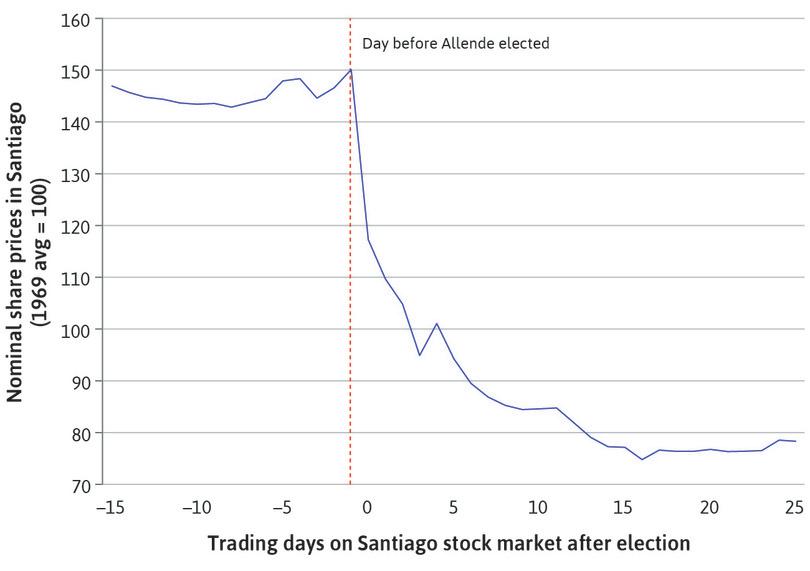
Stock market prices in Chile: The election of a socialist president, 1970.
Figure 22.19 Stock market prices in Chile: The election of a socialist president, 1970.
Proprietary data from the Santiago stock market. Time zero is the first trading day on the Santiago stock market following the election. Daniele Girardi and Samuel Bowles. 2017. ‘Institutional Shocks and Economic Outcomes: Allende’s Election, Pinochet’s Coup and the Santiago Stock Market’. Santa Fe Institute working paper.
Exercise 22.12 Economies succeed when national policies align with individual impulses
In 1759, Adam Smith wrote in The Theory of Moral Sentiments:
The man … enamored of his own ideal plan of government, … seems to imagine that he can arrange the different members of a great society with as much ease as the hand arranges the different pieces upon a chess-board. … but in the great chess-board of human society, every single piece has a principle of motion of its own, altogether different from that which the legislature might choose to impress upon it. If those two principles coincide and act in the same direction, the game of human society will go on easily and harmoniously, and is very likely to be happy and successful. If they are opposite or different, the game will go on miserably, and the society must be at all times in the highest degree of discord.
- In your own words, explain Smith’s idea of the economic feasibility of government policies.
- Using what you have learned about the constraints faced by the Central Bank as a policymaker, give an example that illustrates Smith’s point.
Question 22.4 Choose the correct answer(s)
Look again at Figure 22.18a. Which of the following statements are true?
- False. Without the tax on firms, the new equilibrium point would be at the intersection of the old price-setting curve and the new wage-setting curve. As you can see from the diagram, real wages would remain at the level they were at before the policy was introduced and employment would decrease.
- True. The price-setting curve is horizontal; therefore, unless the price-setting curve moves up or down, any equilibrium will have real wages at the same level.
- True. In the short run, real wages increase and employment is constant. In the long run, real wages and employment both fall.
- False. Unemployment benefits offer valuable insurance to workers who could lose their job. While workers are clearly made worse off by the fall in wages and decrease in employment, they may still benefit overall from the policy.
22.13 Administrative infeasibility
Limited information
- asymmetric information
- Information that is relevant to the parties in an economic interaction, but is known by some but not by others. See also: adverse selection, moral hazard.
Remember that many market failures arise because of asymmetric information—the lender does not know how the borrower will use the funds, the employer does not know how hard the employee will work, the insurance company does not know if the person purchasing life insurance is terminally ill, and so on. The limited information available to the principal in these three cases (the lender, the employer, the insurer) made it impossible for them to write a complete contract with the agent (the borrower, the employee, the insured). A complete contract would have ‘internalized’ the external effects that are the source of the market failure, ensuring that the agent bore all of the costs and enjoyed all of the benefits of his or her actions.
The same is true of environmental market failures. If the citizen suffering from a respiratory illness could bring a lawsuit against the polluting firm that caused it, and secure compensation for the costs of his illness, then this might ‘internalize’ the external costs of the polluter’s actions, leading to more effective abatement efforts. But in most cases, this cannot be done because the citizen does not have the necessary information about who is polluting, and also would not be able to pay the legal and other expenses of pursuing the case.
But this information is not available to the government either, limiting its ability to design policies that address environmental market failures. As we saw in Unit 20, governments often do not know how much citizens value environmental quality, or how effective environmental policies will be in ensuring a sustainable environment. As we also saw, it’s hard for the government to find out this information.
Limited information is not the only factor limiting the administrative feasibility of policies.
Limited capacities
Taxes, as we have seen, can change the way that private actors behave. For example, imposing a tax that raises the price of fuel reduces car journeys and the associated environmental damages. But, to levy taxes effectively and collect the revenue, governments need revenue officers who are competent, not corrupt, with sufficient resources to find and punish tax evaders, and with enough legitimacy that most people pay their taxes. Where this is not the case, sellers would continue selling fuel at a lower price, driving their law-abiding competitors out of business.
- fiscal capacity
- The ability of a government to impose and collect substantial taxes from a population at low administrative and other costs. One measure of this is the amount collected divided by the cost of administering the tax system.
Administrative capacity is required for many different kinds of taxes, from trade tariffs enforced at the border, to payroll taxes levied on wages, and to corporate income taxes charged on legally incorporated economic entities. The use of accounting books in large firms makes it easier to audit firms and accurately assess their tax bill. But this also depends on the technology and institutions available. International flows of difficult-to-track financial obligations makes illegal tax evasion, and legal tax avoidance (for example by moving profits to international tax havens), a problem for governments who want to collect tax. This lowers their fiscal capacity.18
Lack of administrative capacity affects all aspects of government, not just taxes. An educational reform, for example, requiring teachers to abandon rote learning methods and engage in more active student-centered learning may simply be impossible to implement given the skills of the current teaching force.
Administrative infeasibility: An application from Nigeria
A lack of information about the progress of infrastructure projects funded by the government, and a poorly functioning and corrupt administration, resulted in poor outcomes in Nigeria.
In 2006–07, the public sector was given funding and made responsible for implementing 4,700 small-scale infrastructure projects like installing water wells, constructing dams, and building health centres. Just 31% of the projects were completed and 38% were not even started. For example, the funding was paid for 1,348 water wells, but 846 were never completed, leaving hundreds of thousands of people without improved access to water.
Economists Imran Rasul and Daniel Rogger wanted to find out why some organizations succeeded in completing projects on schedule and budget and others did not. They were able to do their research because the Nigerian government had collected information from independent teams of engineers about the quantity and quality of completed projects. Accurate information of this kind from independent observers on the quantity and quality of public services is very rare for a low-income country.19
Rasul and Rogger found that ‘getting things done’ by public sector organizations is affected by how the organizations are managed. They were surprised to discover that using performance incentives, with which managers were rewarded for good performance as measured by the organization (not by independent assessors), was correlated with lower completion rates. In organizations where officials had greater autonomy in making decisions—not in response to performance incentives—outcomes were better.
While financial incentives can play a positive role in motivating government officials, the Nigerian case shows that, if it is difficult to collect and verify information, trying to attach simple performance incentives to complex tasks may backfire. If there is poor information, then it may be better to give organizations greater autonomy. In this case, officials given automony observed social norms of responsibility, and completion rates were higher.
22.14 Special interests
In a democracy, it is often said that ideally the government is the servant of the people. In economic terms, government officials are the agents and the citizens are the principals.
- principal-agent relationship
- This relationship exists when one party (the principal) would like another party (the agent) to act in some way, or have some attribute that is in the interest of the principal, and that cannot be enforced or guaranteed in a binding contract. See also: incomplete contract. Also known as: principal-agent problem.
But this immediately raises two questions:
- Why would the agent (the elected official) do what the principals (the citizens) desire? As in any principal-agent relationship the agent has his or her own objectives, and they differ from the principal’s objectives. Our model of the government as a monopolist illustrated how the government need not serve the interests of the people in an undemocratic society. We saw that the problem does not disappear in a democracy.
- Who are ‘the people’? In economic terms, who is (or are) the principal(s)? Until now the principal has been the lender or the employer, which we could simplify by representing as a single individual. But there are many citizen-principals and they have differing priorities for what the government should do, whether the question is abatement of pollution, school improvement, policies to boost innovation, tax-funded transfers to the poor, and so on.
Democratic accountability of elected officials
Think about the first problem—motivating the elected official to do what the citizens prefer—as a principal-agent problem, like the employer trying to motivate a worker to contribute to the profits of the firm. What are the possible solutions when the manager tries to motivate workers? The manager could:
- Pay the agent an economic rent: She will fear losing it if she does an unsatisfactory job.
- Monitor the work activity of the employee: To detect signs of inadequate work.
- Replace the worker by another worker: If the work is found to be unsatisfactory.
In a democracy, elected officials are held accountable to the electorate by a similar set of strategies:
- Give the official a sufficient salary, prestige, and other amenities of office: The offical would then like to keep the job.
- Monitor the activities of the government: To determine the quality of the government’s performance using legal principles of transparency and judicial review, along with a free press and free speech.
- Hold periodic elections: A government that has not performed well in the citizens’ eyes is replaced by a different set of political leaders.
- short-termism
- This subjective term refers to the case when the person making a judgement places too much weight on costs, benefits, and other things occurring in the near future than would be appropriate.
This is how democracies solve the principal-agent problem of making elected officials accountable to the public. But it comes with a downside: the fact that officials, like employees, are subject to periodic review gives them an incentive to undertake projects whose objectives will become visible before the next election. This is called short-termism.
Governments, for example, sometimes introduce expansionary fiscal policies (cutting taxes or expanding spending) in the run-up to elections, so that disposable incomes will be rising and unemployment falling when people vote. Attempts to push employment above the long-run sustainable level (recall the labour market model) will eventually lead to unsustainable inflationary pressures. But these unwanted consequences would occur only after the election.
Because future elections are an incentive for short-term thinking by political leaders, a partial solution is to remove some policymaking from the hands of elected officials. This is the argument for an independent (not elected) judicial system, and for the political autonomy of the central bank.
For example, the governors of the US Federal Reserve system are appointed by the president for 14-year terms which are staggered, so that it is unlikely that a president will appoint many of them while in office. Figure 15.18 shows when central banks across countries in the world adopted inflation-targeting. This was a signal of a greater degree of autonomy of central bank decision making. Also in the US, presidential appointments to the Supreme Court are for life.
Policymaking in a democracy is also sometimes biased in favour of smaller groups. Here is the reason. Consider a policy, such as a reduction in tariffs on imports of clothing, which will make less-expensive clothing available to the population but reduce the employment and income of workers in the domestic clothing industry. Suppose that it will confer a total of €1 million of costs on the 500 clothing workers and at the same time will confer €2 million of benefits on 2 million consumers of clothing.
Now consider the challenges facing those seeking to organize campaigns against and for the policy:
- Each worker in the domestic indstry would lose €2,000 a year if the legislation were passed, so most would support the ‘anti-import’ cause, and be against the tariff reduction.
- Each consumer would benefit by €1 if the legislation were passed, so few people would be willing even to send an email to their legislator.
‘All animals are equal. But some are more equal than others.’
This quote is from George Orwell’s 1945 book Animal Farm, which was a satirical critique of Joseph Stalin’s dictatorship of the Soviet Union. But it also applies to how democracies work in practice. All citizens are legally equal in their rights, but some have much more power to influence government policy than others.20
This concerns the second question at the beginning of this section: when persuading elected officials to favour one policy over another, citizens are far from equal. Wealthy citizens in particular may have a disproportionate voice in a democracy because:
- Wealthy citizens invest: Their decisions about investment (the case of Chile, for example) may determine the fate of a government.
- Wealthy citizens donate to politicians: Their contributions to electoral campaigns (in countries where this is allowed), or even direct personal payments, may influence either who is elected or what the elected officials do once in office.
- Wealthy citizens control communications: Some own and direct newspapers and TV stations.
- Wealthy citizens employ lobbyists: They, or the firms they own, employ professionals—often former politicians—to influence elected officials.
The result is that economic inequality feeds political inequality, which in turn feeds economic inequality.
For evidence on how political contributions (as well as special interests) influenced US housing market policy prior to the crisis, read: Atif Mian, Amir Sufi, and Francesco Trebbi. 2013. ‘The Political Economy of the Subprime Mortgage Credit Expansion’. Quarterly Journal of Political Science 8: pp. 373–408.
For example, the relationship between economic inequality and political inequality affects gender outcomes. In many countries, women participate much less in political life and leadership than men. In India, the reservation of positions for women to head village councils has been shown to increase public spending on the public services that women prefer, like wells, so that they do not have to carry water so far. It also reduces receipts of bribes by those in power and was found to transform stereotypes. Men in villages that were randomly reserved for women leaders subconsciously perceived women more positively as leaders, as compared with viewing them solely in domestic roles.
How economists (and political scientists) learn from facts Does money talk?
In the US, people often say ‘money talks’. Many are concerned that it talks particularly loudly when it comes to politics.
To some, it is obvious that when a candidate for political office receives a large contribution for his electoral campaign from a business, or a trade union with an economic interest at stake, the candidate will be more likely to take the side of the contributor when it comes to using political power to influence policy.
We know the election campaigns for the US congress in 2012 spent on average $8.5 million per congressional seat, as a paper on procuring access to congressional representatives relates. But did the winners provide favours for the donors that would not have occurred without the donors’ contributions?
We might ask if the members of congress who received contributions from those with investments in the oil industry tended to favour the interests of those firms afterwards. Or did those receiving funds from trade union members support an agenda that favoured the union’s interests? The answer in both cases would be that they did.
But this does not demonstrate that donor contributions purchased influence over the legislator. Remember causation can work both ways: those with oil wealth are likely to donate to candidates who already favour that industry’s interests. Trade union members will donate money to those who already support the interests of trade unions. Simply showing a correlation between the source of the funding and the policies supported by the legislator does not show that the contributions caused the legislator to act differently.
Political scientists Joshua Kalla and David Brockman designed a clever experiment to see if the donation caused the congress member to behave in the donor’s interest. They reasoned that citizens could influence legislators by meeting with them and expressing their views. Members of Congress are busy people, so gaining access to them for a meeting is something that groups compete for.21
They wanted to find out if those who gave money to a congress member were more likely to be granted a meeting. With the cooperation of a (real) interest group Credo Action, they contacted 191 members of congress to ask for a meeting. All of the constituents making this request had contributed some funds to the member’s campaign. The control group, randomly chosen, and half of the total sample, said only that they were residents of the member’s district. The treatment group also identified themselves as donors. All callers in both groups read from a script, so the requests for a meeting were otherwise identical.
Among those not identified as donors, 2.4% gained a meeting with either the congress member or the chief of staff. For those identified as donors, 12.5% got a meeting.
The authors concluded:
The vast majority of Americans who cannot afford to contribute to campaigns in meaningful amounts are at a disadvantage when attempting to express their concerns to policy makers.
Special interests: The story of Chile continued
What happened after the election of Allende in Chile in 1970 tells a story not only of economic limits to feasible policies, but also of political limits.
Amid faltering economic performance, due in part to potential investors holding back on investment in Chile, opposition to Allende mounted, some of it supported in secret by the US government. In 1973, the Chilean armed forces attacked the presidential palace, defeating troops loyal to Allende. They took over the government, ending democracy and replacing Allende with the unelected General Augusto Pinochet.
Stock market prices in Chile: The military overthrow of the socialist government, 1973.
Figure 22.20a Stock market prices in Chile: The military overthrow of the socialist government, 1973.
Time zero is the first trading day on the Santiago stock market following the military takeover.
The wealthy anticipated that Pinochet would introduce pro-business policies, so stock prices rose again (Figure 22.20a). The Pinochet dictatorship would remain until a constitutional referendum in 1988 demanded a return to democracy, which the armed forces respected.
Once again, a sharp change in behaviour of the wealthy is recorded in the stock market prices on the day following the referendum.
Stock market prices in Chile: The 1988 referendum, ending military rule.
Figure 22.20b Stock market prices in Chile: The 1988 referendum, ending military rule.
Time zero is the first trading day on the Santiago stock market following the referendum.
Allende’s economic program was infeasible for two reasons:
- It was economically infeasible: He could not force private firms to invest in Chile, and without their investment the economy would stagnate or even shrink.
- It was politically infeasible: Though democratically elected he did not control the Chilean armed forces which, with the support of businesses and the US Central Intelligence Agency, turned against him.
22.15 Policy matters and economics works
In this unit, you have learned that Adam Smith’s reasoning about the men on the chessboard can now be expressed in economic terms by saying that, for a policy to improve an outcome, it must change the current Nash equilibrium to a different and preferable one (economic feasibility). And it also must be favoured by a governing elite with the authority and capacity to implement it (political and administrative feasibility).
The limits posed by special interests, as well as economic and administrative feasibility, explain why governments often do not successfully address the problems of market failure and unfairness that we have encountered throughout this course. Looking at the different economies of the world, however, you see substantial differences in the extent to which these problems are effectively addressed. As a result, the limits posed by economic, political, and administrative feasibility differ substantially among countries.
To see this, return to the problem of climate change and Figure 20.25a. Sweden, Australia and the US have roughly the same per capita income. If they all faced similar constraints of economic, policy, and political feasibility in adopting policies to limit greenhouse gas impacts on climate, then we would expect to see their similarity in income matched by similarity in CO₂ emissions per capita.
But this is not at all what we see in the figure. The US and Australia emit about three times as much per capita as Sweden. It seems likely that what is economically feasible may not differ very much in these three countries, as all share the same knowledge about technologies, and their citizens are likely to respond in similar ways to incentives to adopt cleaner energy sources. The government information and capacities in the three countries are also similar: all have well-informed and capable governments.
{:.show-page-number}, countries with similar per capita income do not necessarily have similar levels of CO<sub>2</sub> emissions per capita.](../images/web/figure-20-25-a.jpg)
As we saw in Figure 20.25a, countries with similar per capita income do not necessarily have similar levels of CO2 emissions per capita.
Although carbon dioxide emissions are affected by industrial structure and trade specialization, they are also affected by what is desired by the elites, who have political influence. Policies to address climate change are more likely to have political support in Sweden than in Australia and the US. One reason for this difference is the importance in US and Australian politics of lobbies representing the natural resource industries, including the gas, oil, and coal producers.
A similar contrast appears when we look at inequality, shown in Figure 19.30. Germany and the US have both experienced about the same rate of growth in GDP per capita over the past four decades, but they differ markedly in inequality of living standards, as can be seen by the much higher Gini coefficient for disposable income in the US. The comparison for the measure of intergenerational inequality is similar. Denmark, Sweden, and Finland are more equal by this measure than even Germany.
Many things could account for these differences. They are, at least in part, due to the greater political influence in Germany than in the US, of those who value sustaining a higher living standard for the least well-off.
{:.show-page-number}, high income countries with a similar growth in GDP per capita do not necessarily have similar levels of inequality.](../images/web/figure-19-30-a.jpg)
As we saw in Figure 19.30a, high income countries with a similar growth in GDP per capita do not necessarily have similar levels of inequality.
What can we learn from these comparisons?
One lesson, if we wish to address problems like climate change and unfair inequalities in living standards, is that for most countries it is possible to do a lot more than is currently being done. The fundamental forces contributing to inequality in the high-income countries—new technologies and growing imports (from China, for example) that make the skills of low-paid workers redundant—do not differ much among the high-income countries in Figure 19.30. The differences appear to be a matter of choices among the similar set of policies that are economically and administratively feasible, some countries opting for policies that sustain high levels of inequality, and others pursuing the goal of greater equality.
We also have a lot to learn from the top performers in these and similar figures, by studying the policies and institutions that appear to account for their success in addressing market failures and unfairness.
Not all policies and institutions that are effective in one country can be transferred to another. The comparison between the innovation systems in Silicon Valley and in Germany in Section 21.2 shows how different combinations of innovating firms, government policies, financial institutions, and social norms in these two regions produce effective solutions to the market failures associated with knowledge production. Neither would be easily adopted in the other country, or in a country like Brazil or Portugal.
Some countries have school systems that teach much more effectively than others. Because educational policies differ greatly among countries, we can get some idea of the importance of good policy by looking at differences among nations in performance on a mathematics test administered to 15-year-old students around the world.
You can access the data from this test at the OECD’s Programme for International Student Assessment.
Let’s compare two countries that are ethnically diverse and have about the same per capita income: the US and Singapore. The average maths score in Singapore was 20% higher than in the US. Even more striking, the student whose score placed him or her in the middle of the US students (the student with the median score) would have been in the bottom quarter of Singapore’s students. A similar comparison would place the median American student in the bottom quarter of Japanese students, and just above the bottom quarter of Finland’s students.
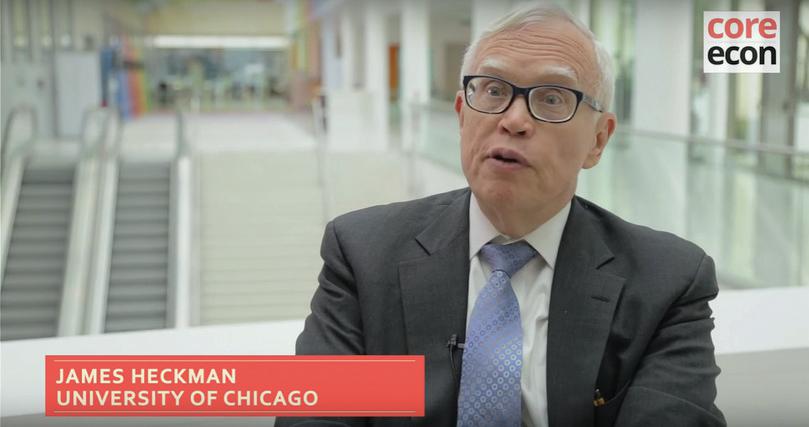
Economic research has explored the question of how schooling and preschool experience affects inequality. A leader in this research is James Heckman, who was the subject of one of our ‘Economist in action’ videos. You may also want to read his book Giving kids a fair chance.22
His book begins by noting that:
The accident of birth is a principal source of inequality in America today. American society is dividing into skilled and unskilled … birth is becoming fate.
Heckman’s ‘strategy that works’ is based on the following logic. ‘Both cognitive and socio-emotional skills develop in early childhood and their development depends on family environment.’ Growing up poor deprives children of opportunities to develop these skills, and ‘family environments in the US have deteriorated’.
In response, Heckman advocates ‘early interventions’ such as enriched preschool environments and home visits by professionals to assist parents, which his research shows can ‘produce positive and lasting effects on children in disadvantaged families.’
Policies of the kind advocated by Heckman are being implemented in countries including Colombia, Jamaica, Chile, and in the state of Orissa in India. Teams of economists and experts in child development are rigorously evaluating them for their longer-term effects and to assess the feasibility of scaling them up from small pilot interventions.
So we know that the kids of poor parents often grow up to be poor. We now also know that this has little to do with genetics, and more to do with the socio-emotional behaviour associated with growing up poor. We now know of, and govenments can implement, effective policy remedies to break this cycle of poverty.
22.16 Conclusion
Harold Lasswell, a prominent mid-twentieth-century American political scientist, is best known for his book Politics: Who gets what, when and how. The title captures a basic point of this unit, though we will go beyond Lasswell’s title. Politics is all about:
- who gets what
- who gets to be what
- who gets to do what
The reason is that political processes determine the rules of the game—the basic institutions that govern how we interact in the economy and other arenas of our society.23
But politics is not simply about dividing up a pie, with the powerful getting the larger slice and the struggle for power sometimes resulting in a smaller pie. Well-designed government policies are also able to increase the size of the pie, improving living standards for the vast majority of people. Examples that you have already seen include the economic policies of the government of China, which since the 1980s resulted in the most rapid eradication of large-scale poverty ever witnessed in human history. Another example was the clean water and sanitation policies that were behind the global reduction in child mortality.
Economics is an essential tool to understanding how government policies can both increase the size of the pie and ensure its fair division. The Economy has given you a way of understanding the manner in which we interact with each other, and with our natural environments in producing our livelihoods. Our economy is all about people and what we do as buyers and sellers, borrowers and lenders, employees and employers, voters and government officials. We learn a lot about this economy by seeing actors as doing the best that they can under a given set of circumstances, while also seeking to change their circumstances, often through political movements and governments.
Economics can help to adequately address the problems of inefficiency and unfairness in our economies, by designing policies that are both economically and administratively feasible. Economics can also play a role in making good policies politically possible: economic reasoning can have a powerful effect on public understanding of what can be done in the economy, and even on what ought to be done.
The capitalist revolution with which we began in Unit 1 and the democratic revolutions—extending the vote to all adults—with which we have concluded here have together produced the distinctive economic and political system under which most readers of The Economy now live. Capitalism and democracy continue to change, and to change the world.
Economics will help you understand how capitalism and democracy together are changing your circumstances, and how you—with others—in turn might participate in this process of change.
Concepts introduced in Unit 22
Before you move on, review these definitions:
22.17 References
- Acemoglu, Daron, and James A. Robinson. 2013. ‘Economics versus politics: Pitfalls of policy advice’. The Journal of Economic Perspectives 27 (2): pp. 173–192.
- Arrow, Kenneth. J. 1978. ‘A cautious case for socialism’. Dissent 25 (4): pp. 472–480.
- Arrow, Kenneth J., and F. H. Hahn. 1991. ‘General Competitive Analysis’, eds. C. J. Bliss and M. D. Intriligator. Advanced Textbooks in Economics Vol. 12. San Francisco: Holden-Day.
- Bakija, Jon, Lane Kenworthy, Peter Lindert, and Jeff Madrick. 2016. How Big Should Our Government Be? Berkeley: University of California Press.
- Besley, Timothy, and Anne Case. 1995. ‘Does electoral accountability affect economic policy choices? Evidence from gubernatorial term limits’. The Quarterly Journal of Economics 110 (3): pp. 769–798.
- Besley, Timothy, and Torsten Persson. 2014. ‘Why do developing countries tax so little?’. The Journal of Economic Perspectives 28 (4): pp. 99–120.
- Bonica, Adam, Nolan McCarty, Keith T. Poole, and Howard Rosenthal. 2013. Why hasn’t democracy slowed rising inequality?. The Journal of Economic Perspectives 27 (3): pp. 103–123.
- Deaton, Angus. 2013. The Great Escape: Health, Wealth, and the Origins of Inequality. Princeton, NJ: Princeton University Press.
- Durlauf, Steven. 2017. ‘Kenneth Arrow and the golden age of economic theory’. VoxEU.org. Updated 8 April 2017.
- Freedom House. 2016. ‘Freedom in the World 2016. Anxious Dictators, Wavering Democracies: Global Freedom under Pressure’. Washington, DC.
- Fujiwara, Thomas. 2015. ‘Voting technology, political responsiveness and infant health: Evidence from Brazil’. Econometrica 83 (2): pp. 423–464.
- Gilens, Martin, Benjamin I. Page. 2014. ‘Testing theories of American politics: Elites, interest groups, and average citizens’. Perspectives on politics 12 (03): pp. 564–581.
- Girardi, Daniele and Samuel Bowles. 2017. ‘Institutional Shocks and Economic Outcomes: Allende’s Election, Pinochet’s Coup and the Santiago Stock Market’. Santa Fe Institute working paper.
- Hamilton, Alexander, James Madison, and John Jay. 1961. The Federalist. Middletown, Ct. Wesleyan University Press.
- Hayek, Friedrich A. 1994. The Road to Serfdom. Chicago, Il: University of Chicago Press.
- Heckman, James. 2013. Giving Kids a Fair Chance: A Strategy That Works. Cambridge, MA: MIT Press.
- Hirschman, Albert O. 1970. Exit, voice, and loyalty: Responses to decline in firms, organizations, and states. Cambridge, Mass: Harvard University Press.
- Hotelling, Harold. 1929. ‘Stability in Competition’. The Economic Journal 39: pp. 41–57.
- Kalla, Joshua L., and David E. Broockman. 2015. ‘Campaign contributions facilitate access to congressional officials: A randomized field experiment’. American Journal of Political Science 60 (3): pp. 1–14.
- Kaufmann, Daniel, Aart Kraay, and Massimo Mastruzzi. 2011. ‘The worldwide governance indicators: methodology and analytical issues’. Hague Journal on the Rule of Law 3 (2): pp. 220–246.
- Lasswell, Harold D. 1936. Politics; who gets what, when and how. New York: Whittlesey House.
- Leibbrandt, Murray, Ingrid Woolard, Arden Finn, Jonathan Argent. 2010. ‘Trends in South African Income Distribution and Poverty since the Fall of Apartheid’. OECD Social, Employment and Migration Working Papers, No. 101. Paris: OECD Publishing.
- Lindert, Peter. 2004. Growing Public: Social Spending and Economic Growth since the 18th Century. Cambridge: Cambridge University Press.
- Martinez-Bravo, Monica, Gerard Padró i Miquel, Nancy Qian, and Yang Yao. 2014. ‘Political reform in China: the effect of local elections’. NBER working paper, 18101.
- Mian, Atif, Amir Sufi, and Francesco Trebbi. 2013. ‘The Political Economy of the Subprime Mortgage Credit Expansion’. Quarterly Journal of Political Science 8: pp. 373–408.
- Miller, Grant. 2008. ‘Women’s suffrage, political responsiveness, and child survival in American history’. The Quarterly Journal of Economics 123 (3): pp. 1287–1327.
- Nuffield Foundation, The. 2010. ‘Mirrlees Review of tax system recommends radical changes’. Updated 10 November 2010.
- O’Brien, Patrick K., and Philip A. Hunt. 1993. ‘The rise of a fiscal state in England, 1485–1815’. Historical Research 66 (160): pp.129–76.
- OECD. 2015. Programme for International Student Assessment.
- Plummer, Alfred. 1971. Bronterre: A Political Biography of Bronterre O’Brien, 1804–1864. Toronto: University of Toronto Press.
- Przeworski, Adam, Fernando Limongi. 1993. ‘Political regimes and economic growth’. The Journal of Economic Perspectives 7 (3): pp. 51–69.
- Rasul, Imran, Daniel Rogger. 2016. ‘Management of bureaucrats and public service delivery: Evidence from the Nigerian civil service’. The Economic Journal.
- Scheve, Kenneth, and David Stasavage. 2010. ‘The conscription of wealth: mass warfare and the demand for progressive taxation’. International Organization 64 (04): pp. 529–561.
- Scheve, Kenneth, and David Stasavage. 2012. ‘Democracy, war, and wealth: lessons from two centuries of inheritance taxation’. American Political Science Review 106 (01): pp. 81–102.
- Scheve, Kenneth, and David Stasavage. 2016. Taxing the rich: A history of fiscal fairness in the United States and Europe. Princeton University Press.
- Sethi, Rajiv. 2010. ‘The Astonishing Voice of Albert Hirschman’. Rajiv Sethi Blog. Updated 7 April 2010.
- Sethi, Rajiv. 2011. ‘The Self-Subversion of Albert Hirschman’. Rajiv Sethi Blog. Updated 7 April 2011.
- Sethi, Rajiv. 2013. ‘Albert Hirschman and the Happiness of Pursuit’. Rajiv Sethi Blog. Updated 24 March 2013.
- Shleifer, Andrei. 1998. ‘State versus private ownership’. Journal of Economic Perspectives 12 (4): pp. 133–150.
- Smith, Adam. 1759. The Theory of Moral Sentiments. London: Printed for A. Millar, and A. Kincaid and J. Bell.
- Swedberg, Richard. 1991. Joseph A. Schumpeter, The Economics and Sociology of Capitalism. Princeton, NJ: Princeton University Press.
- The Economist. 1999. ‘The grabbing hand’. Updated 11 February 1999.
- Tirole, Jean. 2017. ‘Jean Tirole – Prize Lecture: Market Failures and Public Policy’. Nobel Media AB 2014, 11 May.
- Wood, Elisabeth Jean. 2000. Forging Democracy from Below: Insurgent Transitions in South Africa and El Salvador. Cambridge: Cambridge University Press.
-
Murray Leibbrandt, Ingrid Woolard, Arden Finn, and Jonathan Argent. 2010. ‘Trends in South African Income Distribution and Poverty since the Fall of Apartheid’. OECD Social, Employment and Migration Working Papers, No. 101. Paris: OECD Publishing. ↩
-
Angus Deaton. 2013. The Great Escape: health, wealth, and the origins of inequality. Princeton: Princeton University Press. ↩
-
Peter Lindert. 2004. Growing Public: Social Spending and Economic Growth since the Eighteenth Century. Cambridge: Cambridge University Press. ↩
-
Jon Bakija, Lane Kenworthy, Peter Lindert, and Jeff Madrick. 2016. How Big Should Our Government Be? Berkeley: University of California Press. ↩
-
Andrei Shleifer. 1998. ‘State versus private ownership’. Journal of Economic Perspectives 12 (4): pp. 133–150. ↩
-
Alexander Hamilton, James Madison and John Jay (1961). The Federalist. Middletown, Ct., Wesleyan University Press. ↩
-
Monica Martinez-Bravo, Gerard P. i Miquel, Nancy Qian, and Yang Yao. 2014. ‘Political reform in China: the effect of local elections.’ NBER working paper, 18101. ↩
-
Kenneth J. Arrow .1978. ‘A cautious case for socialism’. Dissent 25 (4): pp. 472–480
Steven Durlauf. 2017. ‘Kenneth Arrow and the golden age of economic theory’. VoxEU.org. Updated 8 April 2017. ↩
-
Thomas Fujiwara. 2015. ‘Voting technology, political responsiveness and infant health: Evidence from Brazil’. Econometrica 83 (2): pp. 423–464. ↩
-
Harold Hotelling. 1929. ‘Stability in Competition’. Economic Journal 39, pp. 41–57. ↩
-
Albert O. Hirschman. 1970. Exit, voice, and loyalty: Responses to decline in firms, organizations, and states. Cambridge, MA: Harvard University Press. ↩
-
Alfred Plummer. 1971. Bronterre: A Political Biography of Bronterre O’Brien, 1804–1864. Toronto: University of Toronto Press. ↩
-
Friedrich A. Hayek. 1994. The Road to Serfdom. Chicago: University of Chicago Press. A condensed version is also available. ↩
-
Daniel Kaufmann, Aart Kraay, Massimo Mastruzzi. 2011. ‘The worldwide governance indicators: methodology and analytical issues’. Hague Journal on the Rule of Law 3 (2): pp. 220–246. ↩
-
Freedom House. 2016. ‘Freedom in the World 2016. Anxious Dictators, Wavering Democracies: Global Freedom under Pressure’. Washington, DC. ↩
-
Grant Miller. 2008. ‘Women’s suffrage, political responsiveness, and child survival in American history’. The Quarterly Journal of Economics 123 (3): pp. 1287–1327. ↩
-
Adam Przeworski and Fernando Limongi. 1993. ‘Political regimes and economic growth’. The Journal of Economic Perspectives 7 (3) pp. 51–69. ↩
-
Timothy Besley and Torsten Persson. 2014. ‘Why do developing countries tax so little?’. The Journal of Economic Perspectives 28 (4): pp. 99–120. ↩
-
Imran Rasul and Daniel Rogger. 2016. ‘Management of bureaucrats and public service delivery: Evidence from the Nigerian civil service.’ The Economic Journal. ↩
-
Kenneth Scheve and Daniel Stasavage. 2010. ‘The conscription of wealth: mass warfare and the demand for progressive taxation’. International Organization 64 (04): pp. 529–561.
Kenneth Scheve and Daniel Stasavage. 2012. ‘Democracy, war, and wealth: lessons from two centuries of inheritance taxation’. American Political Science Review 106 (01): pp. 81–102.
Kenneth Scheve and Daniel Stasavage. 2016. Taxing the rich: A history of fiscal fairness in the United States and Europe. Princeton University Press.
Jacob S. Hacker and Paul Pierson. 2010. ‘Winner-take-all politics: Public policy, political organization, and the precipitous rise of top incomes in the United States’. Politics & Society 38 (2): pp. 152–204. ↩
-
Joshua L. Kalla and David E. Broockman. (2015). ‘Campaign contributions facilitate access to congressional officials: A randomized field experiment’. American Journal of Political Science 60 (3): pp. 1–14.
Adam Bonica, Nolan McCarty, Keith T. Poole, and Howard Rosenthal. 2013. ‘Why hasn’t democracy slowed rising inequality?’ The Journal of Economic Perspectives 27 (3): pp. 103–123.
Martin Gilens and Benjamin I. Page. 2014. ‘Testing theories of American politics: Elites, interest groups, and average citizens’. Perspectives on politics 12 (03): pp. 564–581. ↩
-
James Heckman. 2013. ‘Giving Kids a Fair Chance: A Strategy That Works’. Cambridge, MA: MIT Press. ↩
-
Daron Acemoglu and James A. Robinson. 2013. ‘Economics versus politics: Pitfalls of policy advice’. The Journal of Economic Perspectives 27 (2): pp. 173–192. ↩
