Leibniz
2.7.1 The production function
In our model of an agricultural economy, the production function shows how the output of grain depends on the input of labour—that is, the number of farmers working the land. Here we demonstrate how to represent the production function mathematically, and describe its properties.
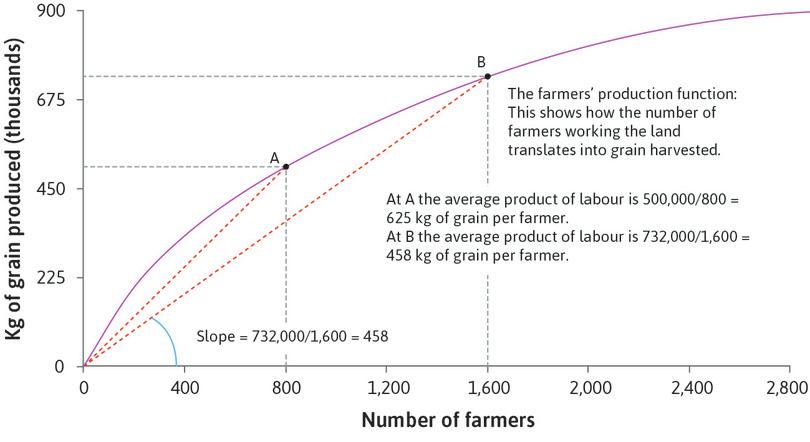
The production function for grain is represented graphically in Figure 1:
If we let be the labour input (number of farmers) and be the amount of grain produced (in kilograms), we can write the production function as:
could be any function, but if it is to represent a production function like the one in the figure, it must have certain properties. First we can see that if the input is zero, no grain is produced, and if the input is greater than zero the amount of grain is strictly positive:
Secondly, the function is increasing: that is, as increases, so does . So its slope, which is given by the derivative of the function, is positive. We can write:
or equivalently:
These two properties are typical of most production functions. Another property of the production function in the figure is that it gets gradually less steep as increases. That is to say, its slope decreases as increases, which means that its second derivative is negative:
or equivalently:
Read more: Section 7.3 (especially page 127) and Section 8.2 of Malcolm Pemberton and Nicholas Rau. 2015. Mathematics for economists: An introductory textbook, 4th ed. Manchester: Manchester University Press.

