Unit 10 Banks, money, and the credit market
Themes and capstone units
How credit, money, and banks expand opportunities for mutual gain, and the factors that limit their capacity to accomplish this
- People can rearrange the timing of their spending by borrowing, lending, investing, and saving.
- While mutual gains motivate credit market transactions, there is a conflict of interest between borrowers and lenders over the rate of interest, the prudent use of loaned funds, and their repayment.
- Borrowing and lending is a principal-agent relationship, in which the lender (the principal) cannot guarantee repayment of the loan by the borrower (the agent) by means of an enforceable contract.
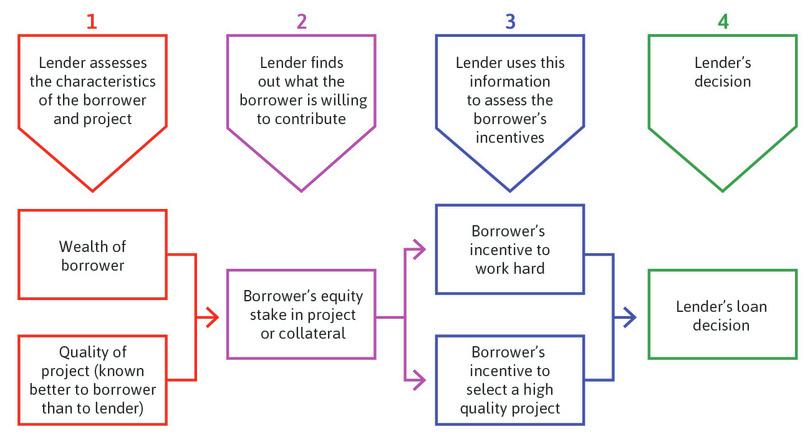
- To solve this problem, lenders often require borrowers to contribute some of their own funds to a project.
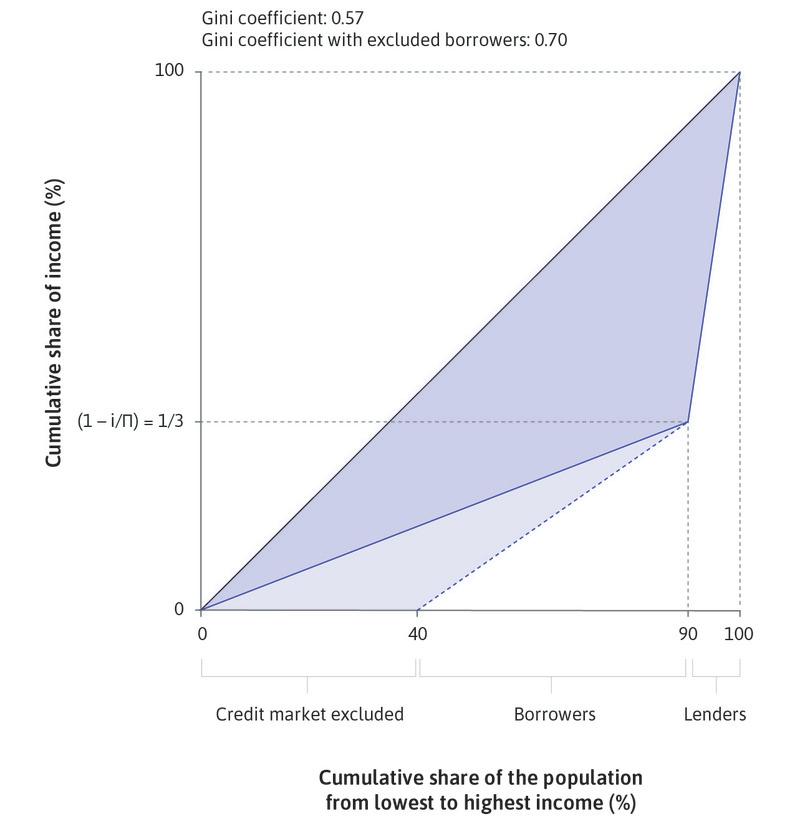
- As a result, people with limited wealth are sometimes unable to secure loans, or can only do so at higher interest rates.
- Money is a medium of exchange consisting of bank notes and bank deposits, or anything else that can be used to purchase goods and services, and is accepted as payment because others can use it for the same purpose.
- Banks are profit-maximizing firms that create money in the form of bank deposits in the process of supplying credit.
- A nation’s central bank creates a special kind of money called legal tender and lends to banks at its chosen policy interest rate.
- The interest rate charged by banks to borrowers (firms and households) is largely determined by the policy interest rate chosen by the central bank.
The market town of Chambar in southeastern Pakistan serves as the financial centre for 2,400 farmers in surrounding villages. At the beginning of the kharif-planting season in April, when they sow cotton and other cash crops, they will buy fertilizer and other inputs. Months have passed since they sold the last harvest and so the only way they can buy inputs is to borrow, promising to repay at the next harvest. Others borrow to pay for medicines or doctors. But few of them have ever walked through the shiny glass and steel doors of the JS Bank on Hyderabad Road. Instead, they visit one of approximately 60 moneylenders.
If they are seeking a first-time loan, they will be questioned intensively by the moneylender, asked for references from other farmers known to the lender, and in most cases given a small trial loan as a test of creditworthiness. The lender will probably visit to investigate the condition of the farmer’s land, animals, and equipment.1
- collateral
- An asset that a borrower pledges to a lender as a security for a loan. If the borrower is not able to make the loan payments as promised, the lender becomes the owner of the asset.
The lenders are right to be wary. If the farmer’s crop fails due to the farmer’s lack of attention, the lender loses money. Unlike many financial institutions, lenders do not usually require that the farmer set aside some property or belongings (called collateral) that would become the lender’s property if the farmer were unable to repay the loan—for example, some gold jewellery.
If the would-be first-time borrower looks reliable or trustworthy enough, he will be offered a loan. In Chambar, this is at an average interest rate of 78% per annum. If the borrower is paying the loan back in four months (the growing period of the crop prior to harvest), 100 rupees borrowed before planting will be paid back as 126 rupees. Knowing that more than half the loan applications are refused, the borrower would consider himself fortunate.
And indeed he would be, at least compared to some people 12,000 km away in New York, who take out short-term loans to be repaid when their next paycheck comes in. These payday loans bear interest rates ranging from 350% to 650% per annum, much higher than the legal maximum interest rate in New York (25%). In 2014, the ‘payday syndicate’ offering these loans was charged with criminal usury in the first degree.2
Given the interest rate, is lending in Chambar likely to be exceptionally profitable? The evidence suggests it is not. Some of the funds lent to farmers are borrowed from commercial banks like the JS Bank at interest rates averaging 32% per annum, representing a cost to the moneylenders. And the costs of the extensive screening and collection of the debts further reduces the profits made by the lenders.
Partly as a result of the careful choices made by the moneylenders, default is rare: fewer than one in 30 borrowers fail to repay. By contrast, default rates on loans made by commercial banks are much higher: one in three. The moneylenders’ success in avoiding default is based on their accurate assessment of the likely trustworthiness of their clients.
Money and trust are more closely related than you might think.
On 4 May 1970, a notice appeared in the Irish Independent newspaper in the Republic of Ireland, titled ‘Closure of Banks’. It read:
As a result of industrial action by the Irish Bank Officials’ Association … it is with regret that these banks must announce the closure of all their offices in the Republic of Ireland … from 1 May, until further notice.
Banks in Ireland did not open again until 18 November, six-and-a-half months later.
Did Ireland fall off a financial cliff? To everyone’s surprise, instead of collapsing, the Irish economy continued to grow much as before. A two-word answer has been given to explain how this was possible: Irish pubs. Andrew Graham, an economist, visited Ireland during the bank strike and was fascinated by what he saw:
Because everyone in the village used the pub, and the pub owner knew them, they agreed to accept deferred payments in the form of cheques that would not be cleared by a bank in the near future. Soon they swapped one person’s deferred payment with another thus becoming the financial intermediary. But there were some bad calls and some pubs took a hit as a result. My second experience is that I made a payment with a cheque drawn on an English bank (£1 equalled 1 Irish punt at the time) and, out of curiosity, on my return to England, I rang the bank (in those days you could speak to someone you knew in a bank) and they told me my cheque had duly been paid in but that on the back were several signatures. In other words, it had been passed on from one person to another exactly as if it were money.
The Irish bank closures are a vivid illustration of the definition of money: it is anything accepted in payment. At that time, notes and coins made up about one-third of the money in the Irish economy, with the remaining two-thirds in bank deposits. The majority of transactions used cheques, but paying by cheque requires banks to ensure that people have the funds to back up their paper payments.
In a functioning banking system the cheque is cashed at the end of the day, and the bank credits the current account of the shop. If the writer of the cheque does not have enough money to cover the amount, the bank bounces the cheque, and the shop owner knows immediately that he has to collect in some other way. People generally avoid writing bad cheques as a result.
Credit or debit cards were not yet widely used. Today, a debit card works by instantly verifying the balance of your bank account and debiting from it. If you get a loan to buy a car, the bank credits your current account and you then write a cheque, use a credit or debit card, or initiate a bank transfer to the car dealer to buy the car. This is money in a modern economy.
So what happens when the banks close their doors and everyone knows that cheques will not bounce, even if the cheque writer has no money? Will anyone accept your cheques? Why not just write a cheque to buy the car when there is not enough money in your current account or in your approved overdraft? If you start thinking like this, you would not trust someone offering you a cheque in exchange for goods or services. You would insist on being paid in cash. But there is not enough cash in circulation to finance all of the transactions that people need to make. Everyone would have to cut back, and the economy would suffer.
How did Ireland avoid this fate? As we have seen, it happened at the pub. Cheques were accepted in payment as money, because of the trust generated by the pub owners. Publicans (owners of the pubs) spend hours talking and listening to their patrons. They were prepared to accept cheques, which could not be cleared in the banking system, as payment from those judged to be trustworthy. During the six-month period that the banks were closed, about £5 billion of cheques were written by individuals and businesses, but not processed by banks. It helped that Ireland had one pub for every 190 adults at the time. With the assistance of pub and shop owners who knew their customers, cheques could circulate as money. With money in bank accounts inaccessible, the citizens of Ireland created the amount of new money needed to keep the economy growing during the bank closure.3 4
Irish publicans and the moneylenders in the market town of Chambar would perhaps not recognize, among the many things they had in common, that they were creating money, and they would not know that in doing so they were providing a service essential to the functioning of their respective economies.5
Not everyone passes the trustworthiness tests set by pub owners and moneylenders, of course. And, in Chambar and New York, some of those who do pay much higher interest rates than others.
10.1 Money and wealth
Borrowing and lending money, and the trust that makes this possible, are about shifting consumption and production over time. The moneylender offers funds to the farmer to purchase fertilizer now, and he will pay back after the crop matures, as long as it was not destroyed by a drought. The payday borrower will be paid at the end of the month but needs to buy food now. She wants to bring some of her future buying power to the present.
The passage of time is an essential part of concepts such as money, income, wealth, consumption, savings, and investment.
Money
- money
- A medium of exchange consisting of bank notes and bank deposits, or anything else that can be used to purchase goods and services, and is accepted as payment because others can use it for the same purpose.
Money is a medium of exchange consisting of bank notes and bank deposits, or anything else that can be used to purchase goods and services, and is accepted as payment because others can use it for the same purpose. The ‘because’ is important and it distinguishes exchange facilitated by money from barter exchange. In a barter economy I might exchange my apples for your oranges because I want some oranges, not because I intend to use the oranges to pay my rent. Money makes more exchanges possible because it’s not hard to find someone who will be happy to have your money (in exchange for something), whereas unloading a large quantity of apples could be a problem. This is why barter plays a limited role in virtually all modern economies.6
For money to do its work, almost everyone must believe that if they accept money from you in return for handing over their good or service, then they will be able to use the money to buy something else in turn. In other words, they must trust that others will accept your money as payment. Governments and banks usually provide this trust. But the Irish bank closure shows that, when there is sufficient trust among households and businesses, money can function in the absence of banks. The publicans and shops accepted a cheque as payment, even though they knew it could not be cleared by a bank in the foreseeable future. As the bank dispute went on, the cheque presented to the pub or shop relied on a lengthening chain of uncleared cheques received by the person or business presenting the cheque. Some cheques circulated many times, endorsed on the back by the pub or shop owner, just like a bank note.
This is the fundamental characteristic of money. It is a medium of exchange.
Money allows purchasing power to be transferred among people so that they can exchange goods and services, even when payment takes place at a later date (for example, through the clearing of a cheque or settlement of credit card or trade credit balances). Therefore, money requires trust to function.
Wealth
- wealth
- Stock of things owned or value of that stock. It includes the market value of a home, car, any land, buildings, machinery or other capital goods that a person may own, and any financial assets such as shares or bonds. Debts are subtracted—for example, the mortgage owed to the bank. Debts owed to the person are added.
One way to think about wealth is that it is the largest amount that you could consume without borrowing, after having paid off your debts and collected any money owed to you—for example if you sold your house, car, and everything you owned.
- human capital
- The stock of knowledge, skills, behavioural attributes, and personal characteristics that determine the labour productivity or labour earnings of an individual. Investment in this through education, training, and socialization can increase the stock, and such investment is one of the sources of economic growth. Part of an individual’s endowments. See also: endowment.
The term wealth is also sometimes used in a broader sense to include immaterial aspects such as your health, skills, and ability to earn an income (your human capital). But we will use the narrower definition of material wealth in this unit.
Income
- income
- The amount of profit, interest, rent, labour earnings, and other payments (including transfers from the government) received, net of taxes paid, measured over a period of time such as a year. The maximum amount that you could consume and leave your wealth unchanged. Also known as: disposable income. See also: pre-tax income.
- earnings
- Wages, salaries, and other income from labour.
Income is the amount of money you receive over some period of time, whether from market earnings, investments, or from the government.
- flow
- A quantity measured per unit of time, such as annual income or hourly wage.
- stock
- A quantity measured at a point in time. It’s units do not depend on time. See also: flow.
Since it is measured over a period of time (such weekly or yearly), it is a flow variable. Wealth is a stock variable, meaning that it has no time dimension. At any moment of time it is just there. In this unit we only consider after-tax income, also known as disposable income.
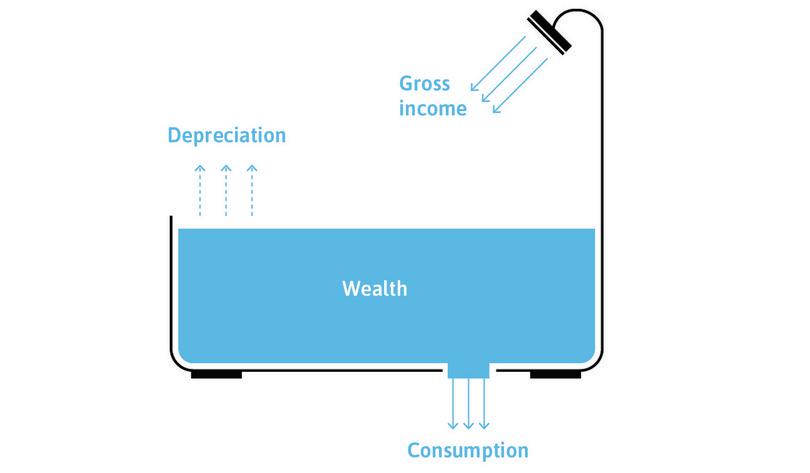
To remember the difference between wealth and income, think of filling a bathtub, as in Figure 10.1. Wealth is the amount (stock) of water in the tub, while income is the flow of water into the tub. The inflow is measured by litres (or gallons) per minute; the stock of water is measured by litres (or gallons) at a particular moment in time.
As we have seen, wealth often takes physical forms such as a house, or car, or office, or factory. The value of this wealth tends to decline, either due to use or simply the passage of time.
- depreciation
- The loss in value of a form of wealth that occurs either through use (wear and tear) or the passage of time (obsolescence).
- net income
- Gross income minus depreciation. See also: income, gross income, depreciation.
This reduction in the value of a stock of wealth over time is called depreciation. Using the bathtub analogy, depreciation would be the amount of evaporation of the water. Like income, it is a flow (you could measure it in litres per year), but a negative one. So when we take account of depreciation we have to distinguish between net income and gross income. Gross income is the flow into the bathtub (remember that income means disposable or after-tax income), while net income is this flow less depreciation. Net income is the maximum amount that you could consume and leave your wealth unchanged.
Expenditure
- consumption (C)
- Expenditure on consumer goods including both short-lived goods and services and long-lived goods, which are called consumer durables.
The tub also has an outflow pipe or drain. The flow through the drain is called consumption expenditure, and it reduces wealth just as net income increases it.
- saving
- When consumption expenditure is less than net income, saving takes place and wealth rises. See also: wealth.
- investment (I)
- Expenditure on newly produced capital goods (machinery and equipment) and buildings, including new housing.
An individual (or household) saves when consumption is less than net income, so wealth increases. Wealth is the accumulation of past and current saving. One form that saving can take is the purchase of a financial asset such as shares (or stocks) in a company or a government bond. Although in everyday language these purchases are sometimes referred to as ‘investment’, in economics, investment means expenditure on capital goods, which are goods such as machinery or buildings.
The distinction between investment and purchasing shares or bonds is illustrated by a sole-proprietor business. At the end of the year, the owner decides what to do with her net income. Out of the net income, she decides on her consumption expenditure for the year ahead and saves the remainder. By default, the saving would take the form of bank deposits since her income would be paid into the bank. With her savings, she could buy financial assets such as shares or bonds, which provide funds to businesses or the government. Or, instead, she could spend on new assets to expand her business, which would be considered an investment.
Question 10.1 Choose the correct answer(s)
Which of the following statements are correct?
- Human capital, such as your health, skills and ability to earn an income, is immaterial wealth.
- Net income is the flow that corresponds to your stock of wealth, so if you consume it all your wealth is unchanged.
- Although in everyday language this is sometimes referred to as investment, in economics, investment means expenditure on capital goods such as machinery, equipment, and housing.
- Depreciation is the loss in the value of a form of wealth through wear and tear or the passage of time.
Question 10.2 Choose the correct answer(s)
Mr Bond has wealth of £500,000. He has a market income of £40,000 per year, on which he is taxed 30%. Mr Bond’s wealth includes some equipment, which depreciates by £5,000 every year. Based on this information, which of the following statements is correct?
- Mr Bond’s disposable income is his market income less tax, which is £40,000 × 0.7 = £28,000.
- Mr Bond’s net income is his disposable income minus depreciation, which is £28,000 – £5,000 = £23,000.
- £23,000 is Mr Bond’s net income. Consuming this amount does not alter his wealth. However Mr Bond can also consume all of his wealth. Therefore his maximum possible consumption expenditure is £500,000 + £23,000 = £523,000.
- 60% of his net income is £13,800, leaving £9,200 to spend on investment.
10.2 Borrowing: Bringing consumption forward in time
To understand borrowing and lending we will use feasible sets and indifference curves. In Units 3 and 5 you studied how Alexei and Angela make choices between conflicting objectives such as free time and grades or bushels of grain. They made choices from the feasible set, based on preferences described by indifference curves that represented how much they valued one objective relative to the other.
- opportunity cost
- When taking an action implies forgoing the next best alternative action, this is the net benefit of the foregone alternative.
Here you will see that the same feasible set and indifference curve analysis applies to choosing between having something now, and having something later. In earlier units we saw that giving up free time is a way of getting more goods, or grades, or grain. Now we see that giving up some goods to be enjoyed now will sometimes allow us to have more goods later. The opportunity cost of having more goods now is having fewer goods later.
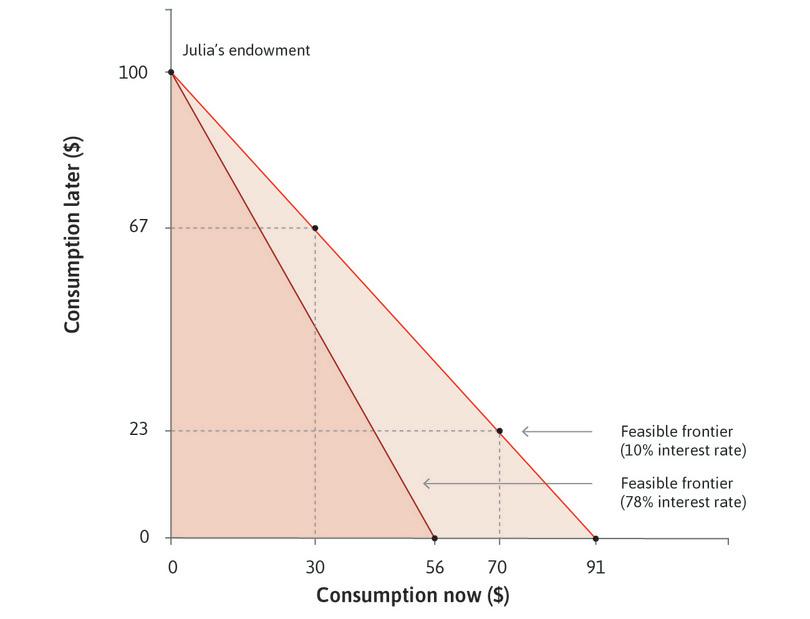
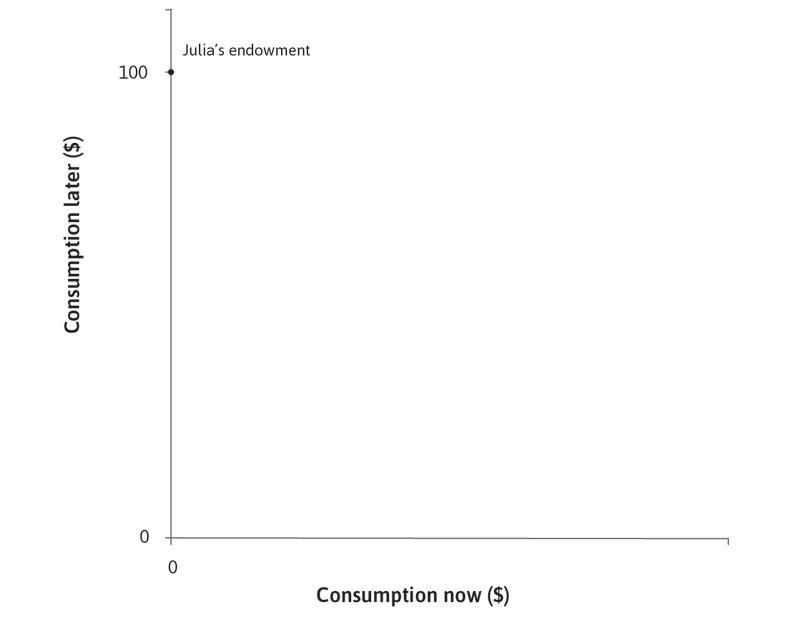
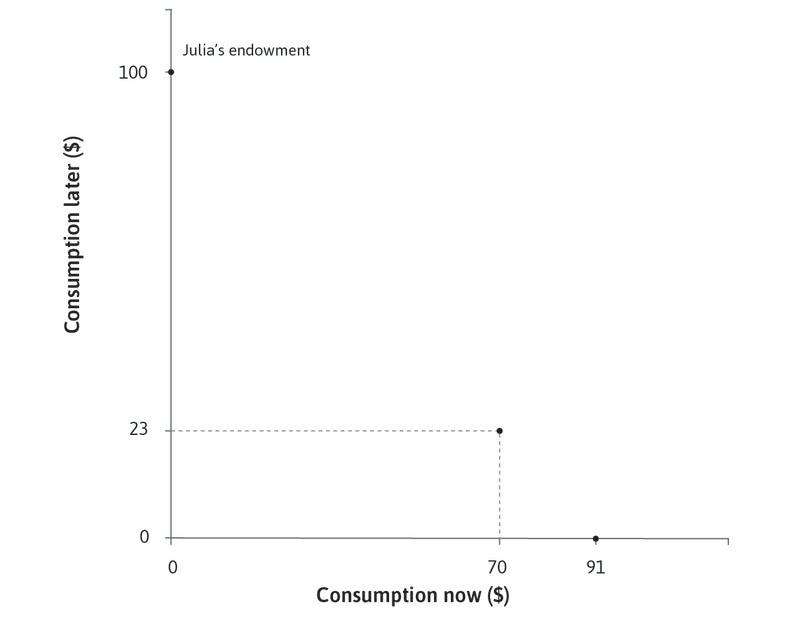
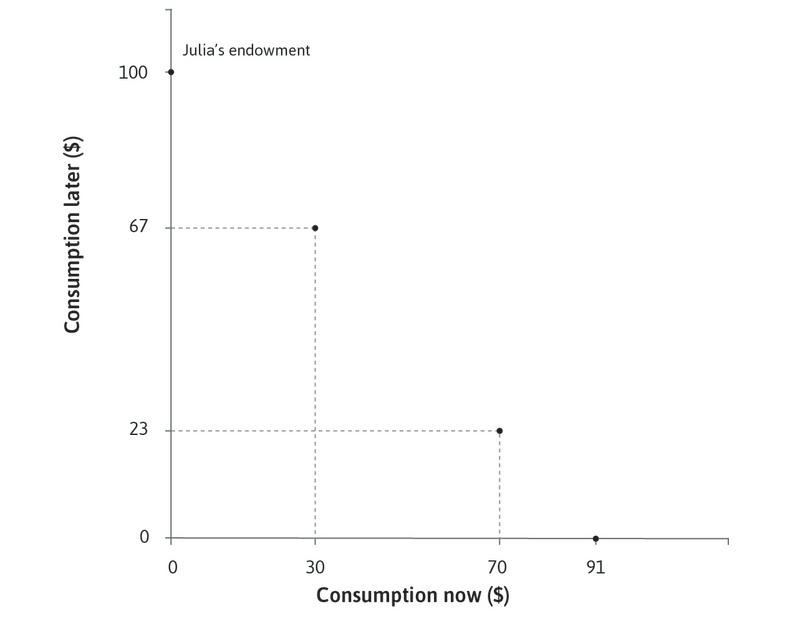
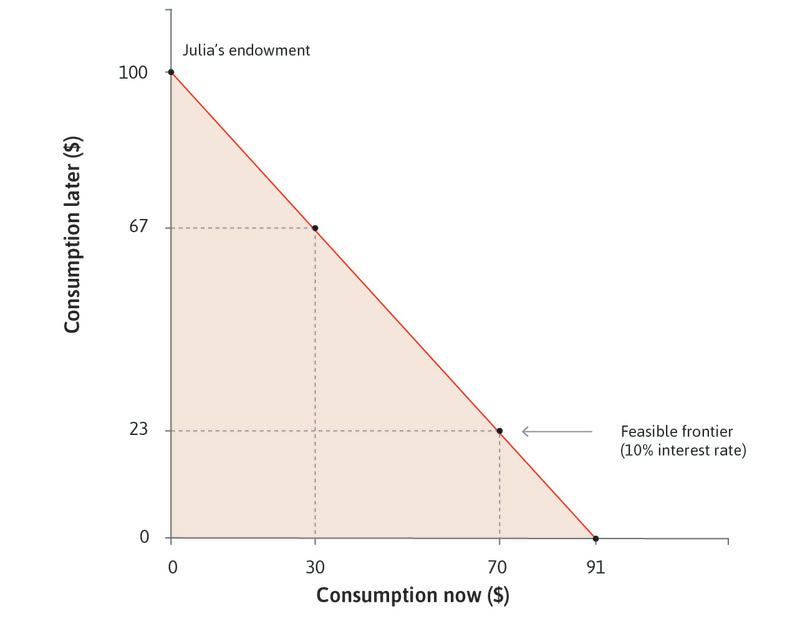
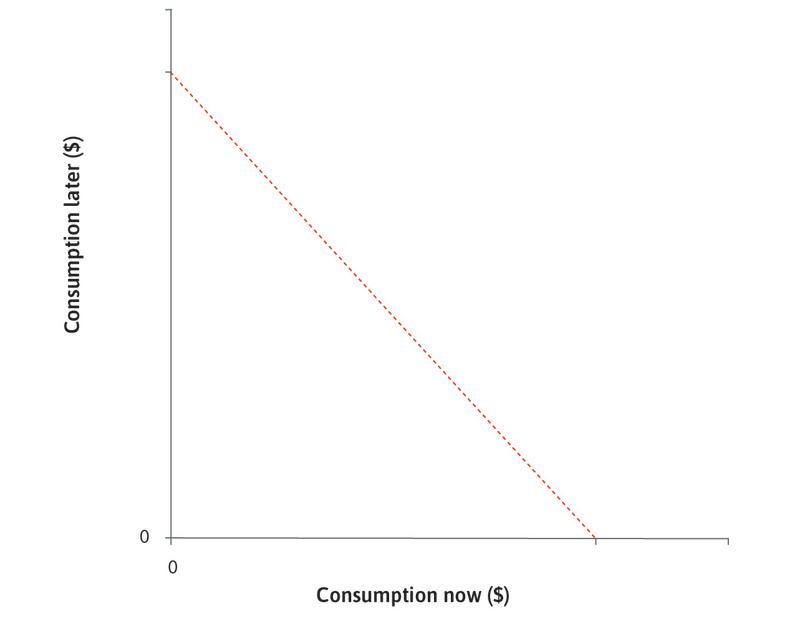
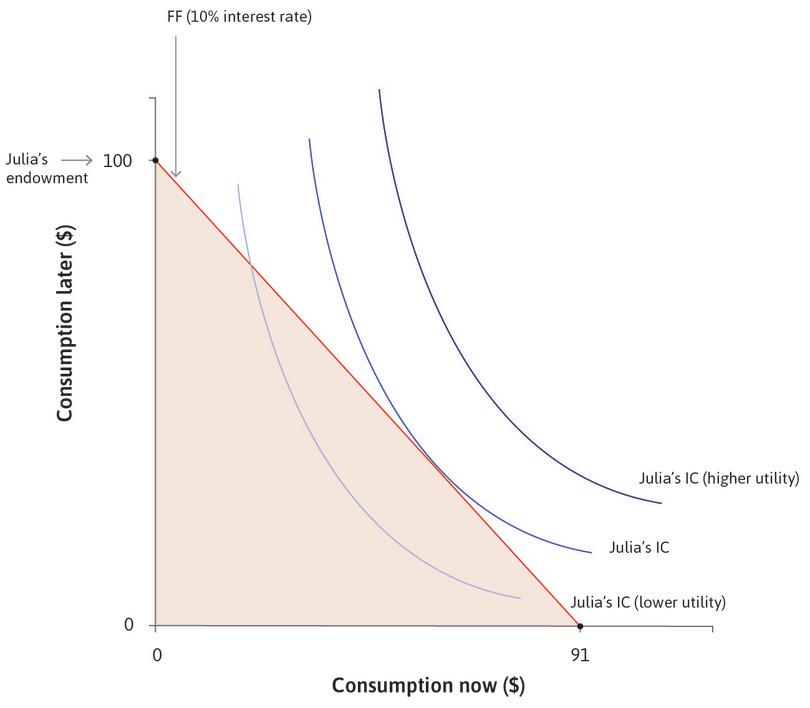
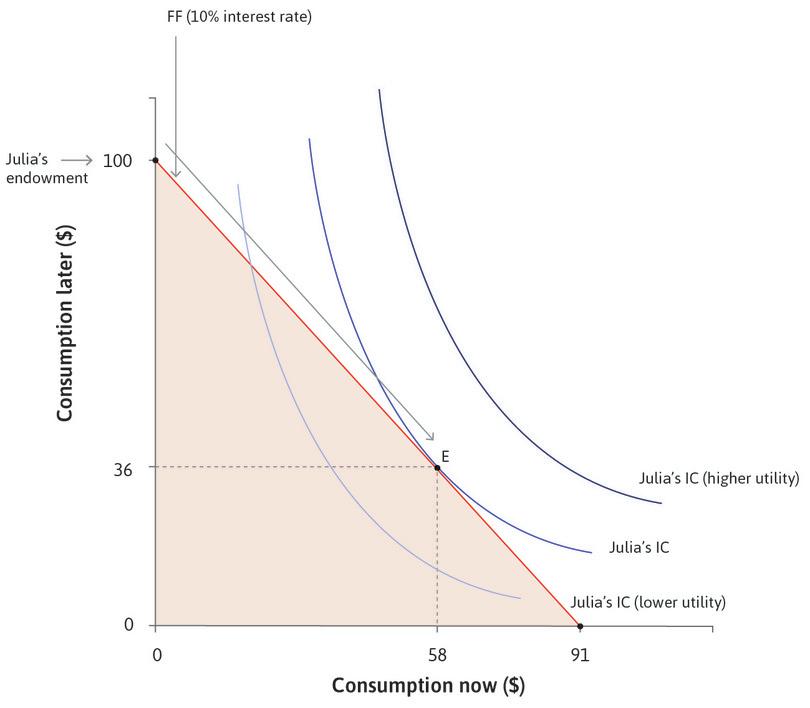
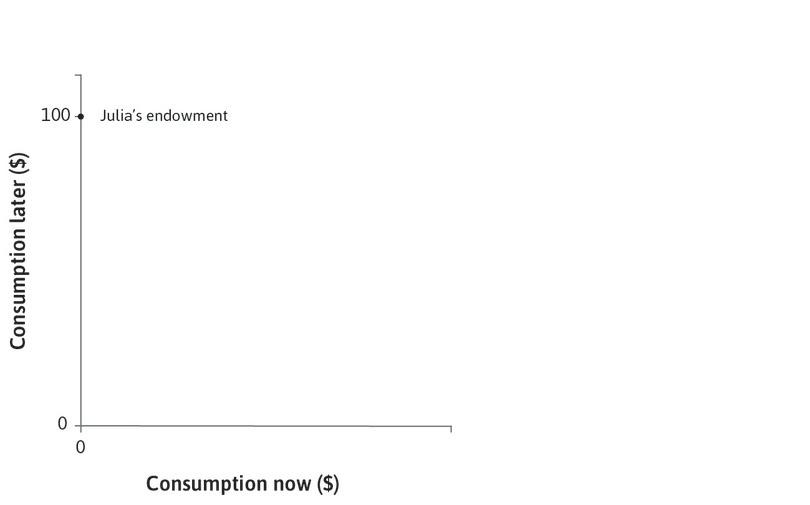
Borrowing and lending allow us to rearrange our capacity to buy goods and services across time. Borrowing allows us to buy more now, but constrains us to buy less later. To see how this works, think about Julia, who needs to consume now but has no money today. She knows that in the next period (later) she will have $100 from her paycheck or harvest. Julia’s situation is shown in Figure 10.2. Each point in the figure shows a combination of Julia’s capacity to consume things, now and later. We assume that she spends everything that she has, so each point in the figure gives her consumption now (measured on the horizontal axis) and later (measured on the vertical axis).
Initially Julia is at the point labelled ‘Julia’s endowment’ in Figure 10.2. To consume now, Julia is considering taking out a payday loan (or she could be a farmer borrowing to finance her consumption before she can harvest and sell her crop).
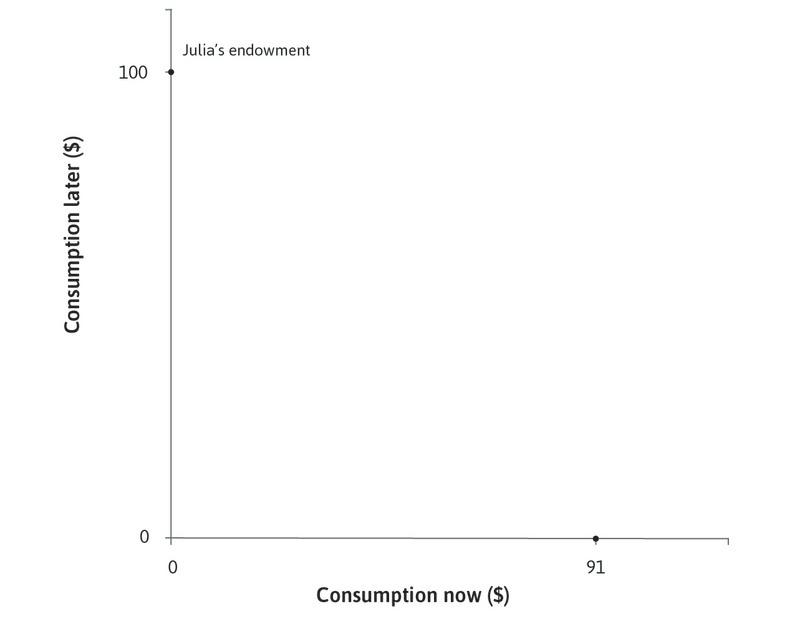
Julia could, for example, borrow $91 now and promise to pay the lender the whole $100 that she will have later. Her total repayment of $100 would include the principal (how much she borrowed) plus the interest charge at the rate r, or:
- interest rate
- The price of bringing some buying power forward in time. See also: nominal interest rate, real interest rate.
And if ‘later’ means in one year from now, then the annual interest rate, r, is:
You can think of the interest rate as the price of bringing some buying power forward in time.
At the same interest rate (10%), she could also borrow $70 to spend now, and repay $77 at the end of the year, that is:
In that case she would have $23 to spend next year. Another possible combination is to borrow and spend just $30 now, which would leave Julia with $67 to spend next year, after repaying her loan.
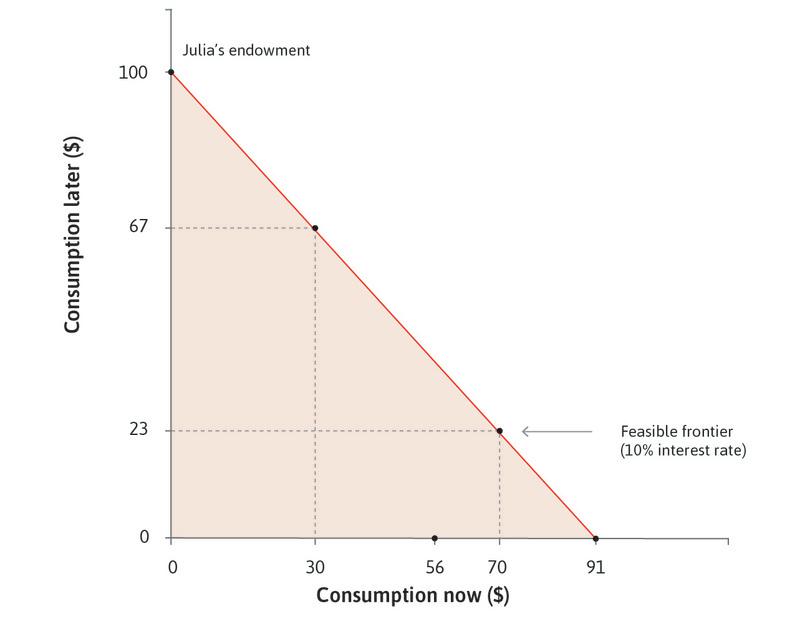
All of her possible combinations of consumption now and consumption later (($91, $0), ($70, $23) ($30, $67), and so on) generate the feasible frontier shown in Figure 10.2, which is the boundary of the feasible set when the interest rate is 10%.
The fact that Julia can borrow means that she does not have to consume only in the later period. She can borrow now and choose any combination on her feasible frontier. But the more she consumes now, the less she can consume later. With an interest rate of r = 10%, the opportunity cost of spending one dollar now is that Julia will have to spend 1.10 = 1 + r dollars less later.
One plus the interest rate (1 + r) is the marginal rate of transformation of goods from the future to the present, because to have one unit of the good now you have to give up 1 + r goods in the future. This is the same concept as the marginal rate of transformation of goods, grain, or grades into free time that you encountered in Units 3 and 5.
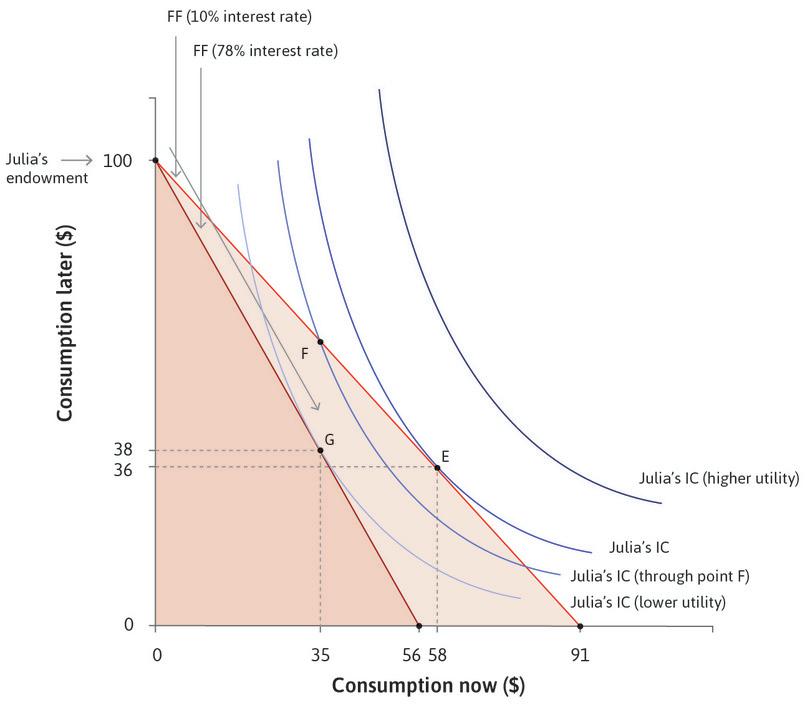
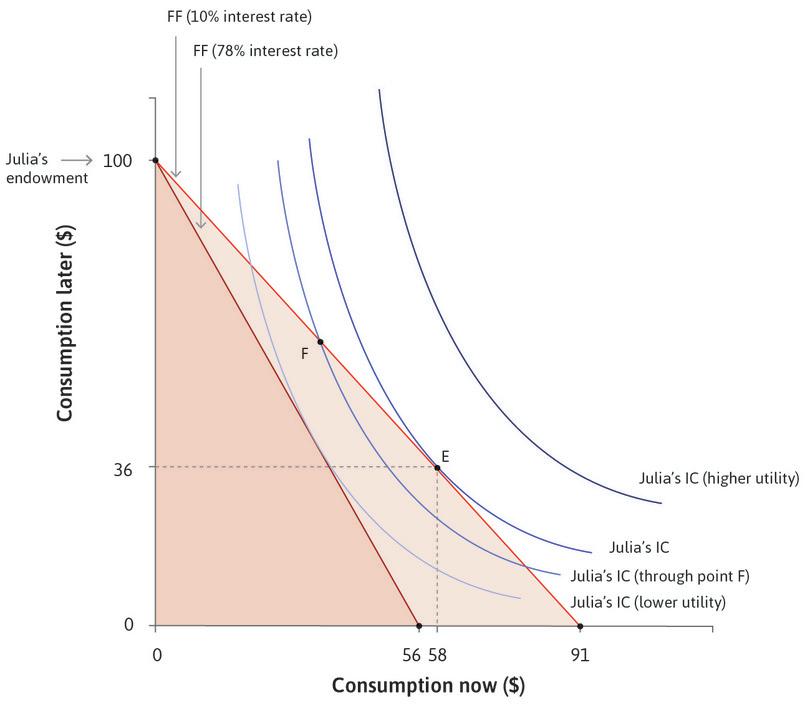
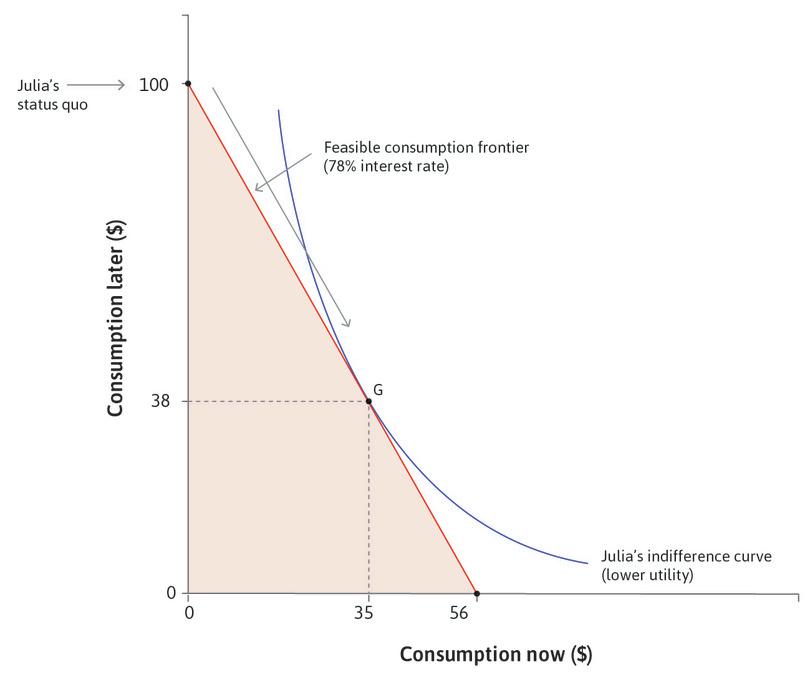
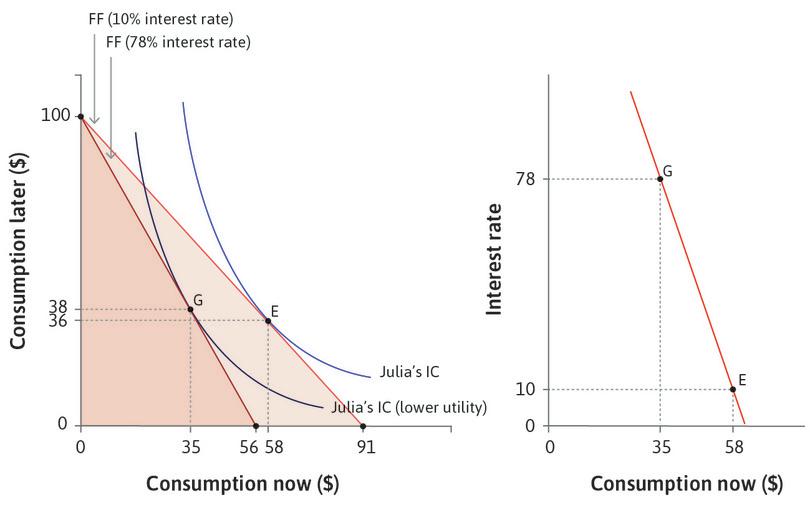
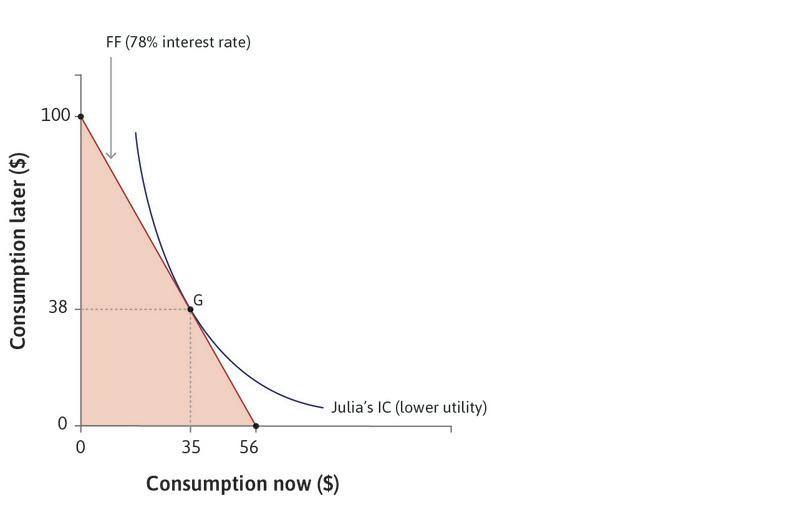
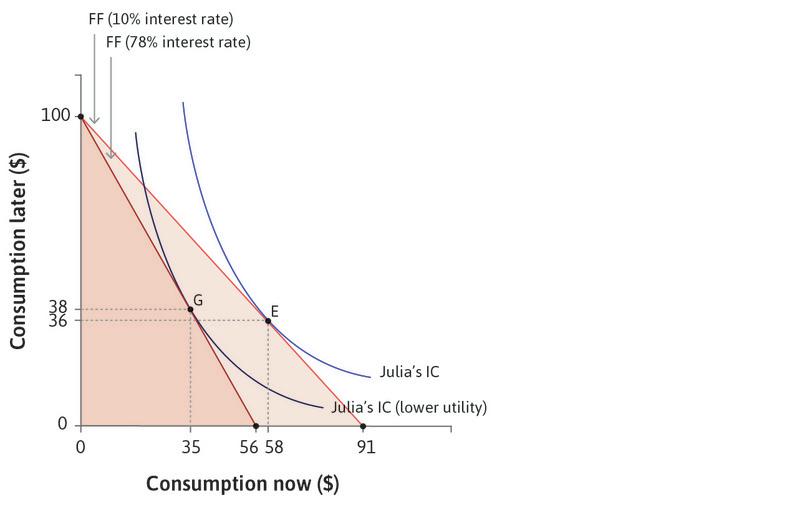
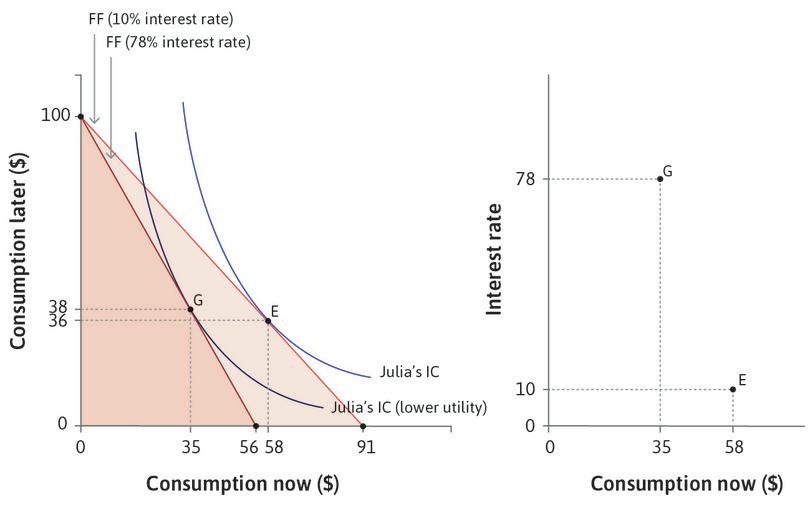
But suppose that, instead of 10%, the interest rate is now 78%, the average rate paid by the farmers in Chambar. At this interest rate Julia can now only borrow a maximum of $56, because at 78% the interest on a loan of $56 is $44, using up all $100 of her future income. Her feasible frontier therefore pivots inward and the feasible set becomes smaller. Because the price of bringing buying power forward in time has increased, the capacity to consume in the present has fallen, just as your capacity to consume grain would fall if the price of grain went up (assuming you are not a producer of grain).
Of course the lender will benefit from a higher interest rate, as long as the loan is repaid, so there is a conflict of interest between the borrower and the lender.
10.3 Impatience and the diminishing marginal returns to consumption
Given the opportunities for bringing forward consumption shown by the feasible set, what will Julia choose to do? How much consumption she will bring forward depends on how impatient she is. She could be impatient for two reasons:
- She prefers to smooth out her consumption instead of consuming everything later and nothing now.
- She may be an impatient type of person.
Smoothing
She would like to smooth her consumption because she enjoys an additional unit of something more when she has not already consumed a lot of it. Think about food—the first few bites of a dish are likely to be much more pleasurable than bites from your third serving. This is a fundamental psychological reality, sometimes termed the law of satiation of wants.
- diminishing marginal returns to consumption
- The value to the individual of an additional unit of consumption declines, the more consumption the individual has. Also known as: diminishing marginal utility.
More generally, the value to the individual of an additional unit of consumption in a given period declines the more that is consumed. This is called diminishing marginal returns to consumption. You have already encountered something similar in Unit 3, in which Alexei experienced diminishing marginal returns to free time. Holding his grade constant, the more free time he had, the less each additional unit was worth to him, relative to how important the grade would be.
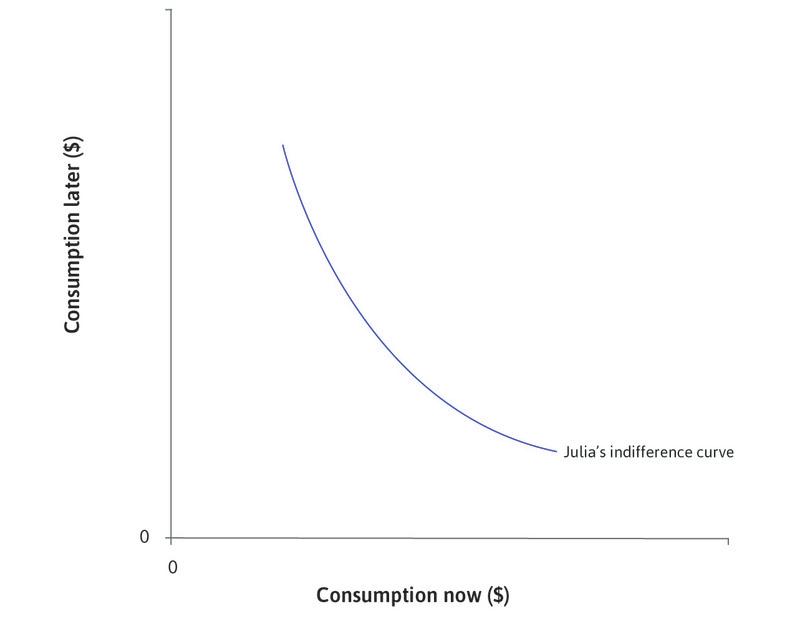
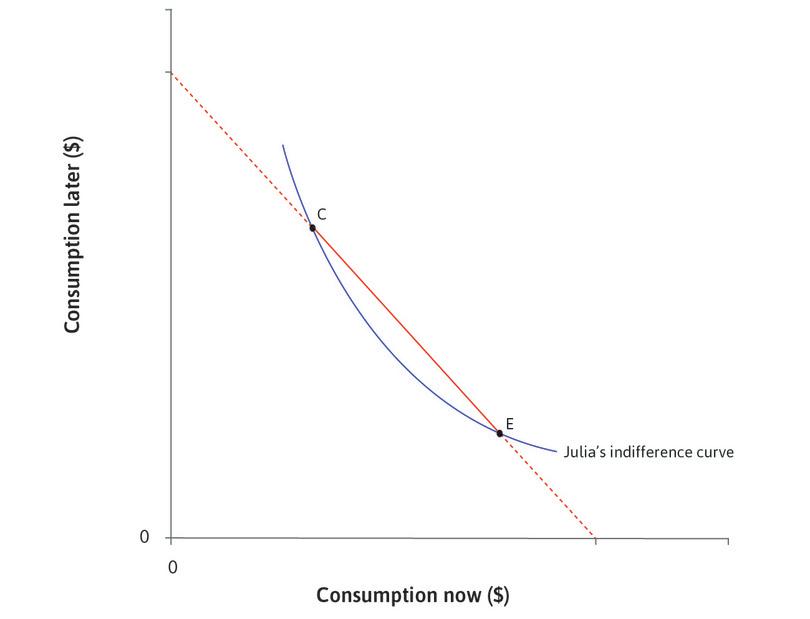
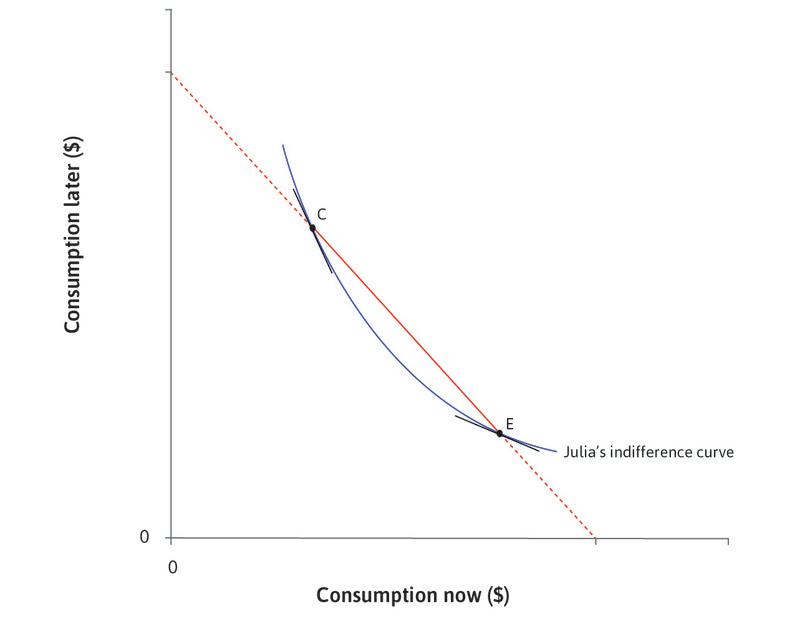
Use the analysis in Figure 10.3a to see how Julia can choose her consumption now and later, and how her preferences can be represented by indifference curves. Diminishing marginal returns to consumption in each period mean that Julia would like to smooth her consumption, that is, to avoid consuming a lot in one period and little in the other.
Pure impatience, or how impatient you are as a person
If Julia knows she can have two meals tomorrow but she has none today, then we have seen that diminishing marginal returns to consumption could explain why she might prefer to have one meal today and one tomorrow instead. Note that Julia would opt for the meal now not because she is an impatient person, but because she does not expect to be hungry in the future. She prefers to smooth her consumption of food.
- pure impatience
- This is a characteristic of a person who values an additional unit of consumption now over an additional unit later, when the amount of consumption is the same now and later. It arises when a person is impatient to consume more now because she places less value on consumption in the future for reasons of myopia, weakness of will, or for other reasons.
But there is a different reason for preferring the good now, called pure impatience. To see whether someone is impatient as a person, we ask whether she values a good now more highly than later, when her initial endowment is having the same amount in both periods. There are two reasons for pure impatience:
- Myopia (short-sightedness): People experience the present satisfaction of hunger or some other desire more strongly than they imagine the same satisfaction at a future date.
- Prudence: People know that they may not be around in the future, and so choosing present consumption may be a good idea.
Impatience
Any preference to move consumption from the future to the present. This preference may be derived from:
- pure impatience
- diminishing marginal returns to consumption
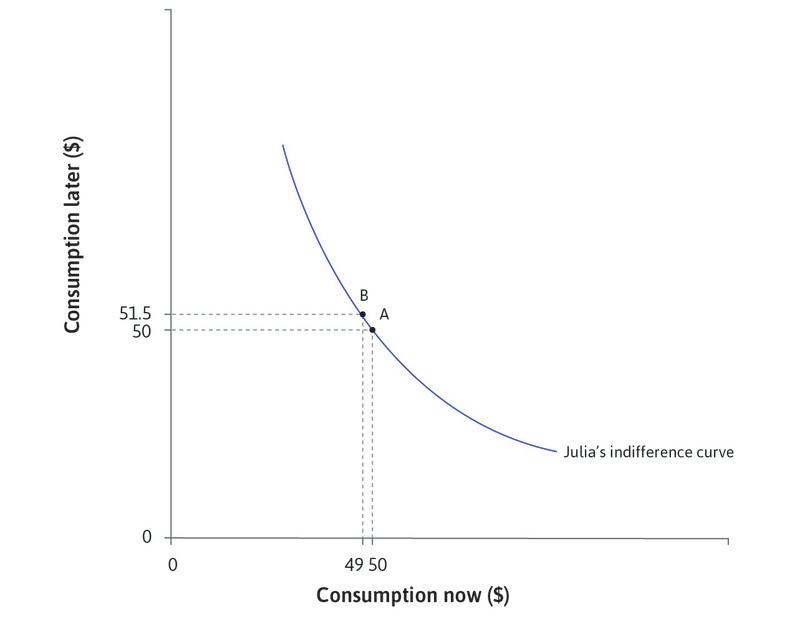
To see what pure impatience means, we compare two points on the same indifference curve in Figure 10.3b. At point A she has $50 now and $50 later. We ask how much extra consumption she would need to have later in order to compensate her for losing $1 now. Point B on the same indifference curve gives us the answer. If she had only $49 now, she would need $51.50 later in order to stay on the same indifference curve and be equally happy. So she needed $1.50 later to compensate for losing $1 now. Julia has pure impatience because rather than preferring to perfectly smooth her consumption, she places more value on an additional unit of consumption today than in the future.
The slope of the indifference curve of 1.5 (in absolute value) at point A in Figure 10.3b means that she values an extra unit of consumption now 1.5 times as much as an extra unit of consumption later.
Exercise 10.1 The consequences of pure impatience
Draw the indifference curves of a person who is more impatient than Julia in Figure 10.3b, for any level of consumption now and consumption later.
Draw a set of indifference curves for Julia if she does not experience diminishing marginal returns to consumption but has pure impatience. Would she then want to smooth her consumption?
Draw a set of indifference curves for Julia if she does not experience diminishing marginal returns to consumption and has no pure impatience.
Question 10.3 Choose the correct answer(s)
Figure 10.3a depicts Julia’s indifference curves for consumption in periods 1 (now) and 2 (later). Based on this information, which of the following statements is correct?
- In order to stay on the same indifference curve, the change in utility due to a marginal change in consumption now must be precisely offset by the change in utility due to the change in consumption later.
- At E, Julia is consuming more now than at C. Due to diminishing marginal returns to consumption, Julia’s marginal return to consumption now is lower at E than at C.
- The two points are on the same indifference curve. Therefore she will be indifferent between the two.
- This depends on the interest rate (one plus interest rate is the slope of the feasible frontier) and the shape of the indifference curves. Julia’s preferred choice is at F, where the consumption in the two periods is not necessarily equal.
10.4 Borrowing allows smoothing by bringing consumption to the present
A person’s discount rate
A person’s discount rate, ρ, is a measure of a person’s impatience: how much she values an extra unit of consumption now over an extra unit of consumption later. This is the slope of her indifference curve between consumption now and consumption later, minus one.
Her discount rate depends on two factors:
Her desire to smooth consumption: This is affected by the situation she is in (the current distribution of consumption now and later).
Her pure impatience as a person: This is also sometimes referred to as her subjective discount rate because it is based in part on her psychology.
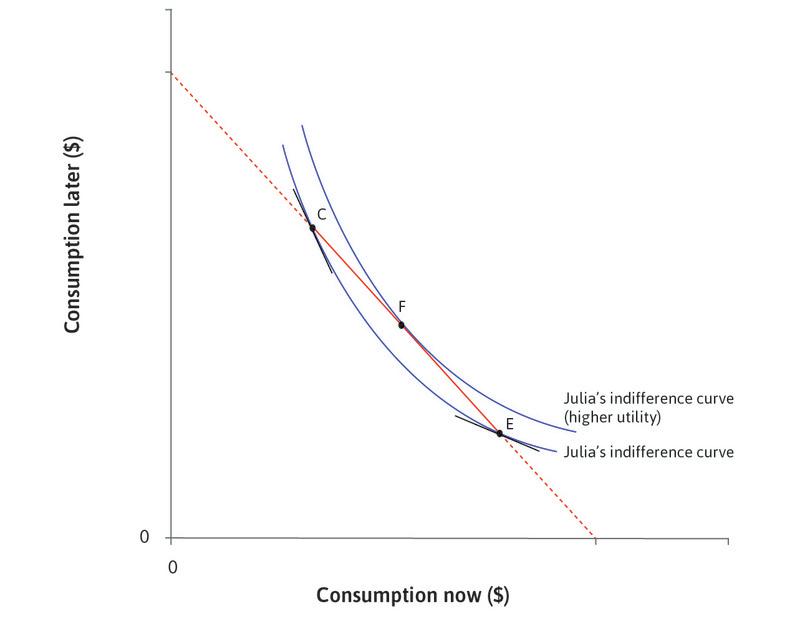
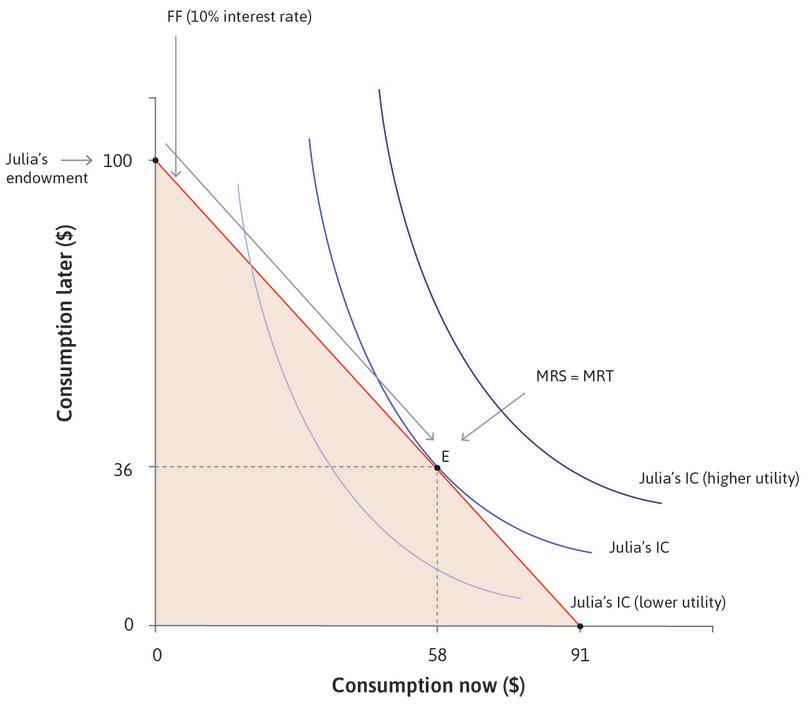
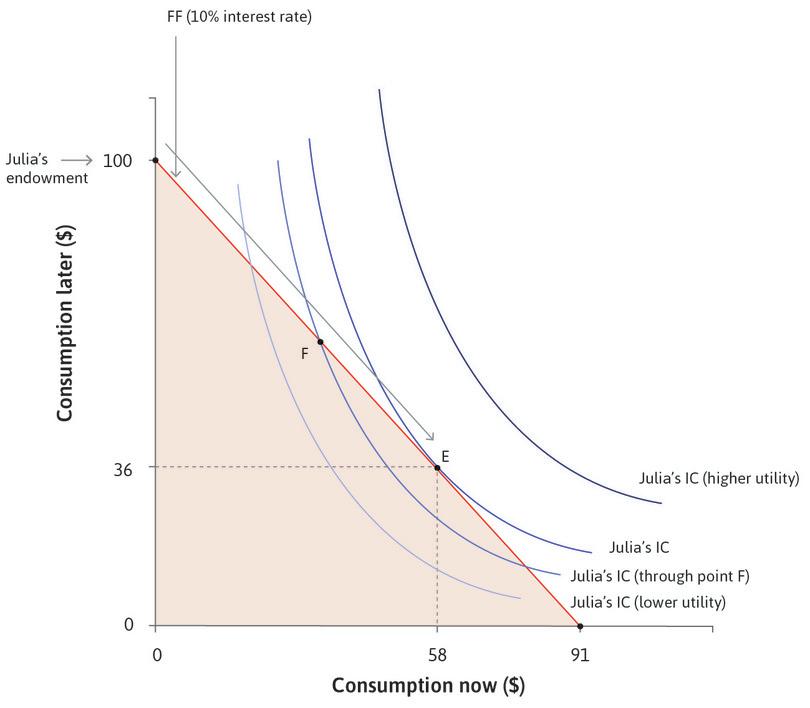
How much will Julia borrow? If we combine Figures 10.2 and 10.3a we will have the answer. As in the other examples of a feasible set and indifference curves, Julia wishes to get to the highest possible indifference curve, but is limited by her feasible frontier. The highest feasible indifference curve when the interest rate is 10% will be the one that is tangent to the feasible frontier, shown as point E in Figure 10.4.
Here, she chooses to borrow and consume $58 and repay $64 later, leaving her $36 to consume later. We know that at this tangency point, the slope of the indifference curve is equal to the slope of the feasible frontier (otherwise the curves would cross). We define a person’s discount rate, ρ (economists use the Greek letter rho, which rhymes with ‘toe’), as the slope of the indifference curve minus one, which is a measure of how much Julia values an extra unit of consumption now, relative to an extra unit of consumption later.
For example, in Figure 10.3b, ρ = 50% at point A because an extra unit of consumption today was worth 1.5 extra units later. This means that Julia borrows just enough so that:
We know that:
So:
If we subtract 1 from both sides of this equation we have:
Her discount rate ρ depends on both her desire to smooth consumption and on her degree of pure impatience.
Use the analysis in Figure 10.4 to see how Julia will choose consumption when the interest rate is 10% and when it is 78%.
Exercise 10.2 Income and substitution effects
- Use Figure 10.4 to show that the difference in current consumption at the lower and higher interest rate (at E and G), namely $23, is composed of an income effect and a substitution effect. It will be helpful to review income and substitution effects from Unit 3 before doing this.
- Why do the income and substitution effects work in the same direction in this example?
Question 10.4 Choose the correct answer(s)
Figure 10.4 depicts Julia’s choice of consumptions in periods 1 and 2. She has no income in period 1 (now) and an income of $100 in period 2 (later). The current interest rate is 10%. Based on this information, which of the following statements is correct?
- At F, the slope of the indifference curve is steeper than that of the feasible frontier. Therefore Julia’s discount rate exceeds the interest rate.
- E is on the highest feasible indifference curve because any higher indifference curves would not touch the budget constraint line.
- At E, Julia consumes 58 in period 1 and 36 in period 2.
- G is in Julia’s feasible set. She does not choose it because it is not the optimal choice (it is on a lower indifference curve).
10.5 Lending and storing: Smoothing and moving consumption to the future
Now think about Marco, an individual facing a different situation from Julia who was considering a payday loan, or a farmer in Chambar seeking a loan until the harvest. While Julia is deciding how much to borrow, Marco has some goods or funds worth $100, but does not (yet) anticipate receiving any income later. Julia and Marco will both get $100 eventually, but time creates a difference. Marco’s wealth, narrowly defined, is $100. Julia’s wealth is zero.
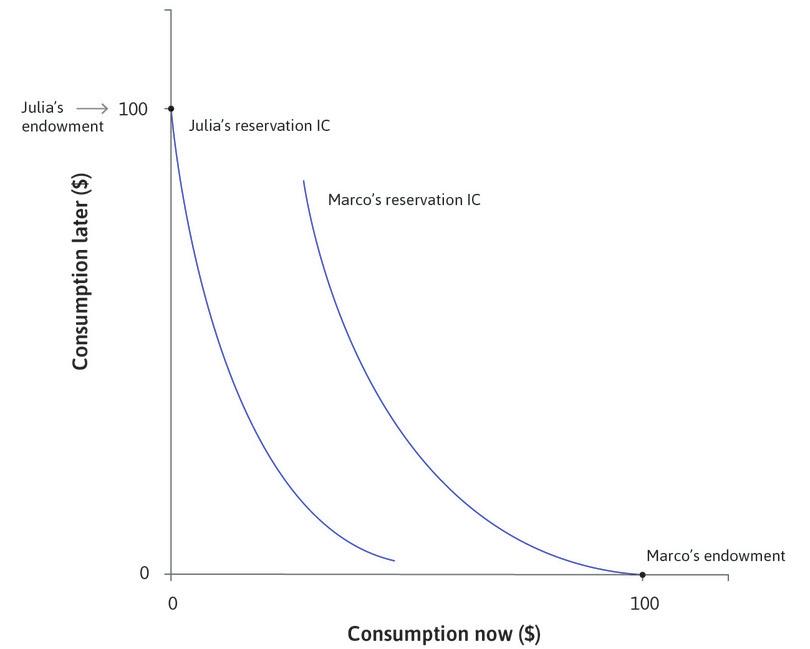
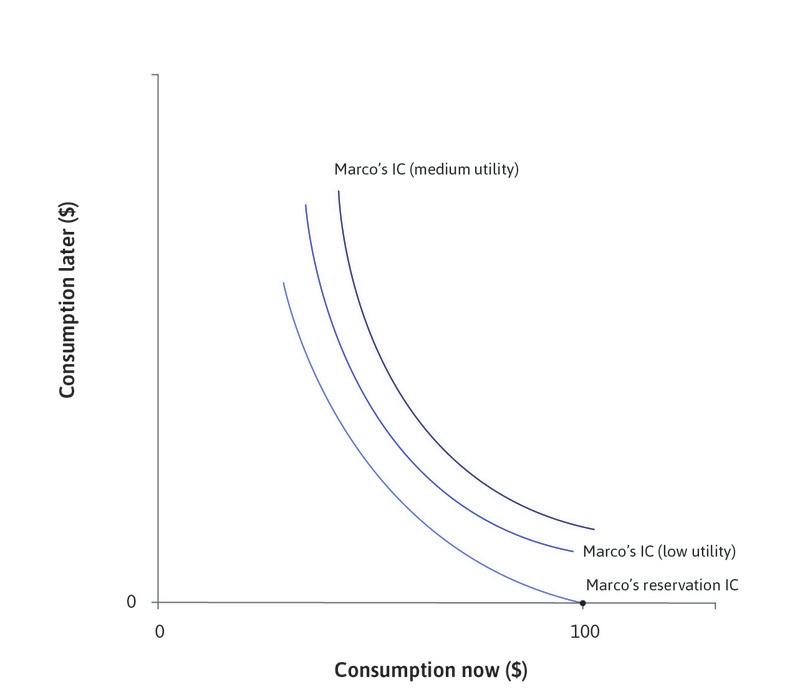
We saw that Julia, who will earn $100 in the future, wants to borrow. The situation that she is in gives her a strong desire to smooth by borrowing. Think about what Julia’s indifference curve, passing through her endowment point, might look like. As shown in Figure 10.5, it is very steep. Because she currently has nothing, she has a strong preference for increasing consumption now.
- reservation indifference curve
- A curve that indicates allocations (combinations) that are as highly valued as one’s reservation option.
This is called Julia’s reservation indifference curve, because it is made of all of the points at which Julia would be just as well off as at her reservation position, which is her endowment with no borrowing or lending (Julia’s endowment and reservation indifference curves are similar to those of Angela, the farmer, in Unit 5).
Look at Marco’s indifference curve passing through his endowment point, which is $100 now and nothing later. As shown in Figure 10.5, it is quite flat now, indicating that he is looking for a way to transfer some of his consumption to the future.
Marco and Julia’s indifference curves and hence their pure impatience are similar. They differ according to their situation, not their preferences. Julia borrows because she is poor in the present, unlike Marco, and that is why she is impatient—she needs to smooth her consumption.
Marco has $100 worth of grain just harvested, and no debts to pay off. He could consume it all now, but as we have seen, this would probably not be the best he could do given the circumstances:
- We have assumed his income in the future is zero.
- Like Julia, he has diminishing marginal returns to consumption of grain.
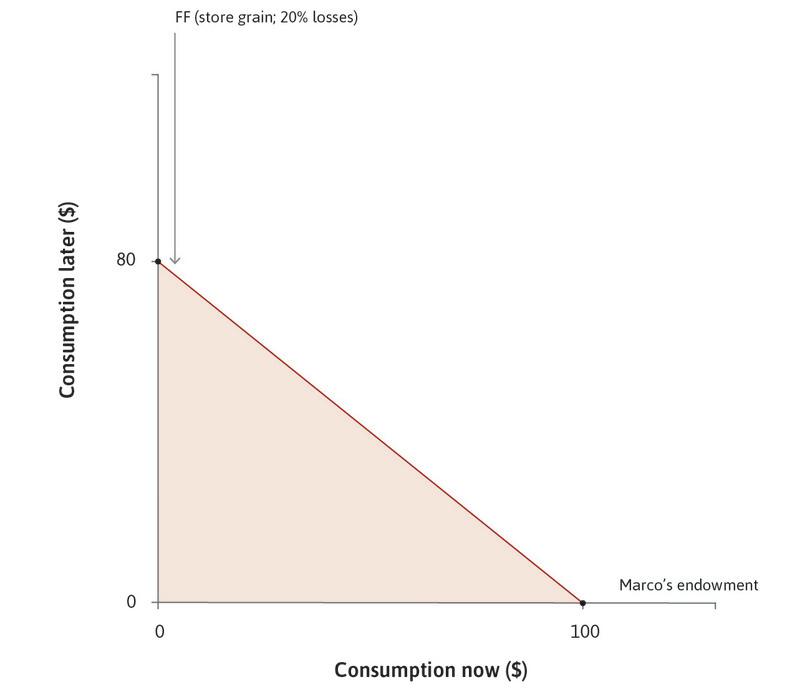
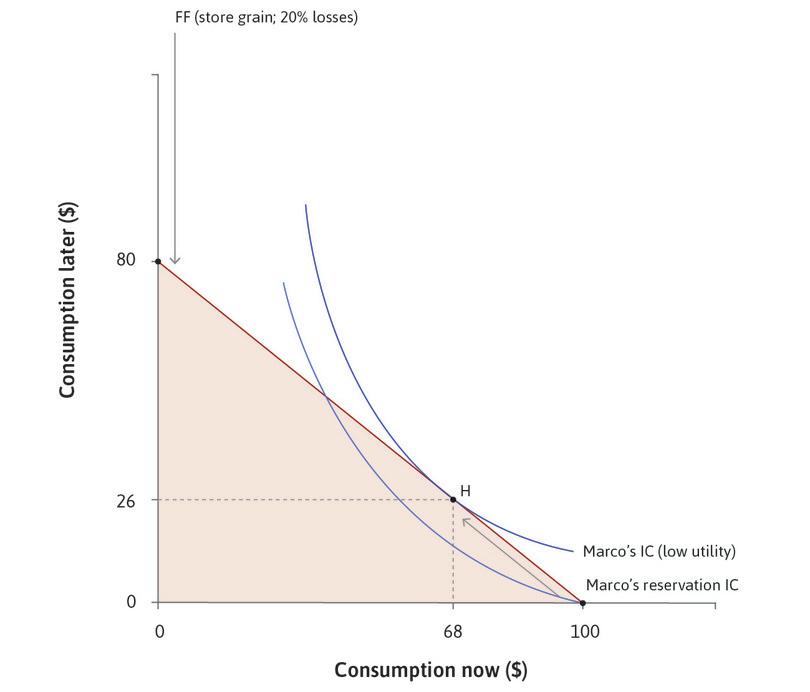
In order to smooth, he wishes to move some goods to the future. He could store the grain, but if he did, mice would eat some of it. Mice are a form of depreciation. The grain they eat represents a reduction in Marco’s wealth due to the passage of time. So, taking account of the mice, if he consumed nothing at all during this period he would have just $80 worth of grain a year later. This means that the cost of moving grain from the present to the future is 20% per year.
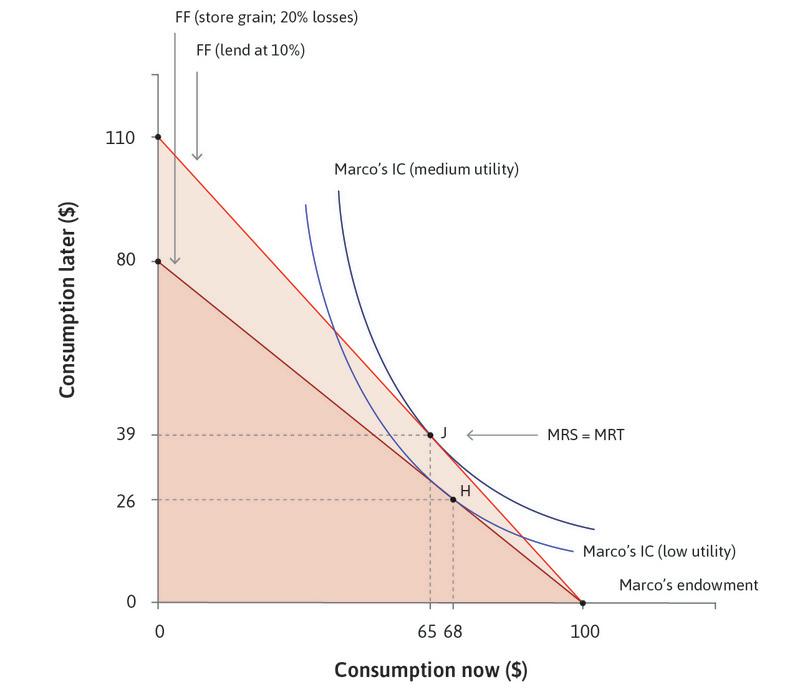
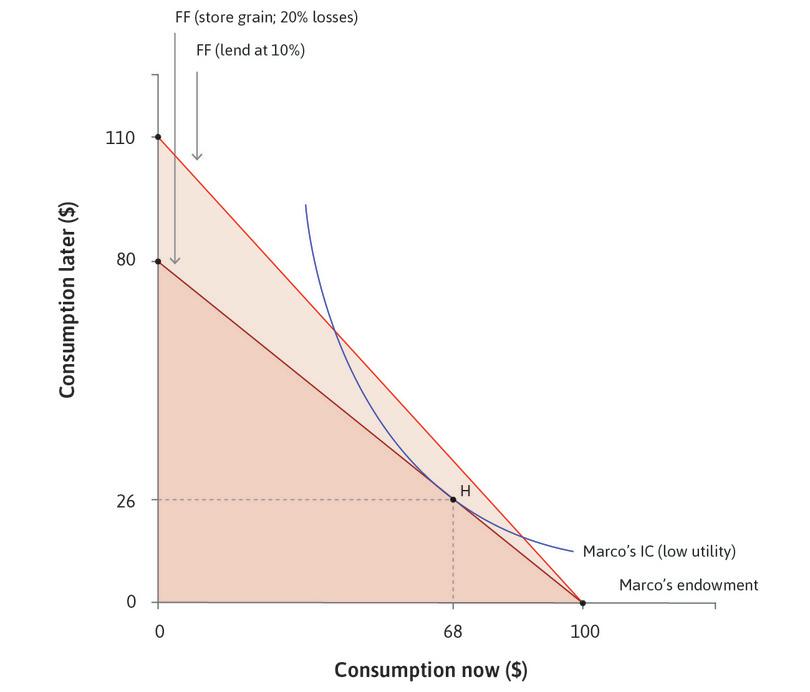
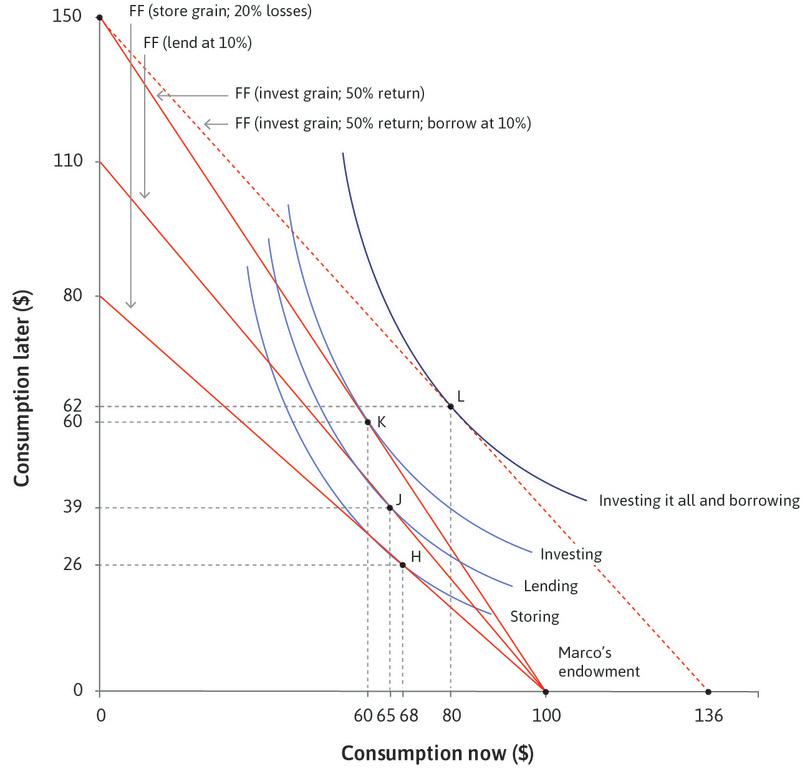
In Figure 10.6, we see that Marco’s endowment is on the horizontal axis, as he has $100 of grain available now. The dark line shows Marco’s feasible frontier using storage, and the dark shaded area shows his feasible set. If this were the only option, and if his indifference curves were as indicated, he would definitely store some of the grain. In Figure 10.6, some part of his feasible frontier lies outside his endowment indifference curve, so he can do better by storing some grain.
But how much? Like Julia, Marco will find the amount of storage that gets him to the highest feasible indifference curve by finding the point of tangency between the indifference curve and the feasible frontier. This is point H, so he will eat $68 of the grain now, and consume $26 of it later (mice ate $6 of the grain). At point H, Marco has equated his MRS between consumption now and in the future to the MRT, which is the cost of moving goods from the present to the future.
He could avoid the mice by selling the grain and putting $100 under his mattress. His feasible frontier would then be a straight line (not shown) from consumption now of $100, to consumption later of $100. We are assuming that his $100 note will not be stolen and that $100 will purchase the same amount of grain now and later because there is no inflation (we explain inflation, and its effects, in Unit 13). Under these assumptions, storing money under the mattress is definitely better than storing grain when there are mice.
A better plan, if Marco could find a trustworthy borrower, would be to lend the money. If he did this and could be assured of repayment of $(1 + r) for every $1 lent, then he could have feasible consumption of 100 × (1 + r) later, or any of the combinations along his new feasible consumption line. The light line in Figure 10.6 shows the feasible frontier when Marco lends at 10%. As you can see from the figure, compared to storage or putting the money under his mattress, his feasible set is now expanded by the opportunity to lend money at interest. Marco is able to reach a higher indifference curve.
As we have seen, in a contemporary economy, there are a variety of financial instruments that Marco can use to shift consumption to the future by lending such as term deposits, or bonds issued by companies or by the government.
If Marco faced an investment opportunity that meant he could invest his asset today and have it be worth more in a year—for instance, if he owns land where he could use the grain as seed and cultivate more grain—then that would similarly expand his feasible set.
10.6 Investing: Another way to move consumption to the future
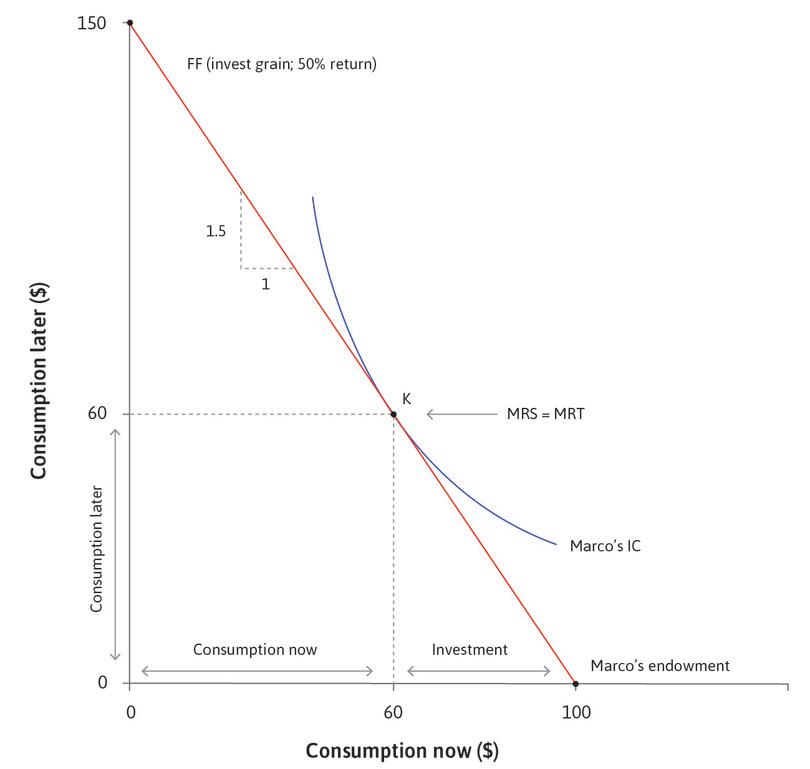
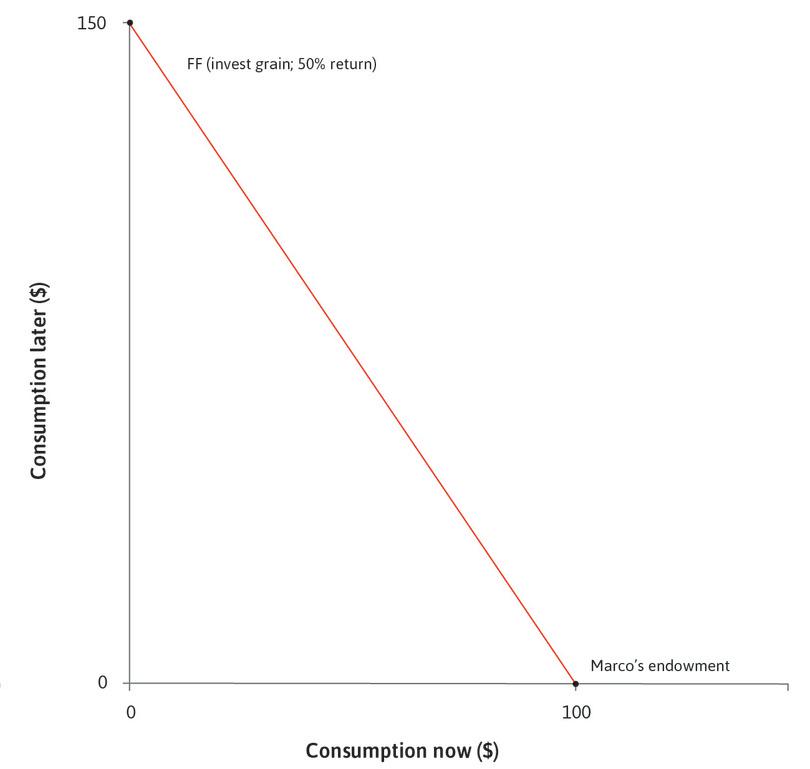
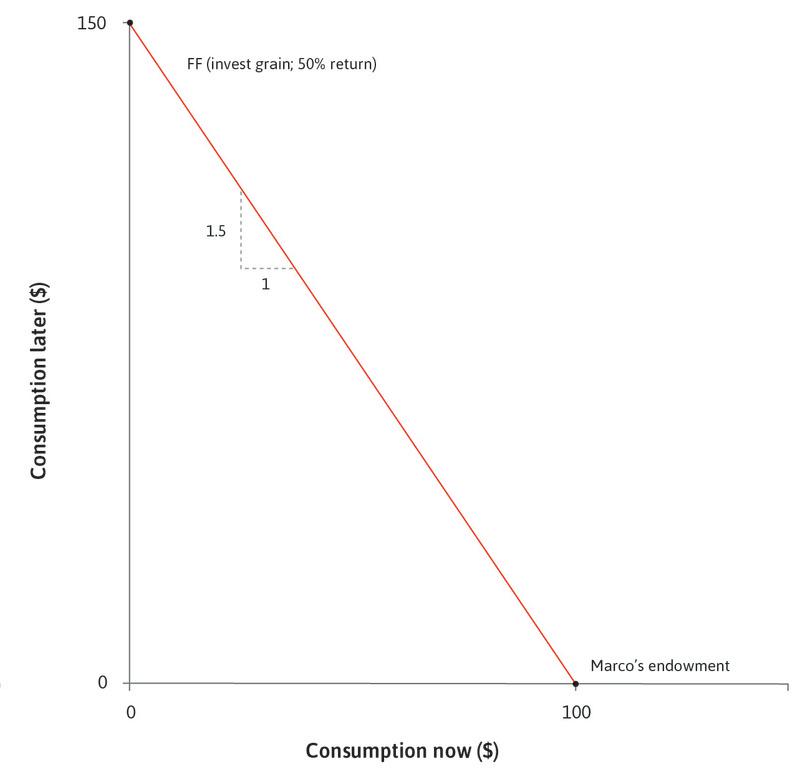
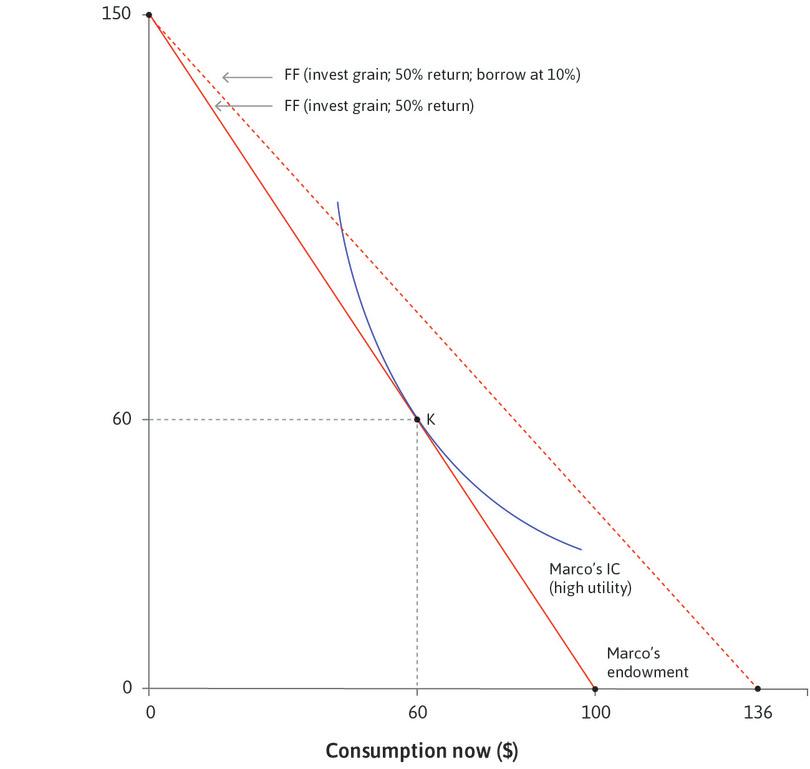
If Marco owns some land, he could do even better. He could invest the grain (planting it as seed and feeding it to his draft animals to help him work the fields until harvest). This opportunity to invest will further expand his feasible set. Suppose that if he were to invest all of his grain, he could harvest $150 worth of grain later, as shown in Figure 10.7. He has invested $100, harvested $150, and so earned a profit of $150 − $100 = $50, or a profit rate (profits divided by the investment required) of $50/$100 = 50%. The slope of the red line is −1.5, where the absolute value (1.5) is the marginal rate of transformation of investment into returns, or 1 plus the rate of return on the investment.
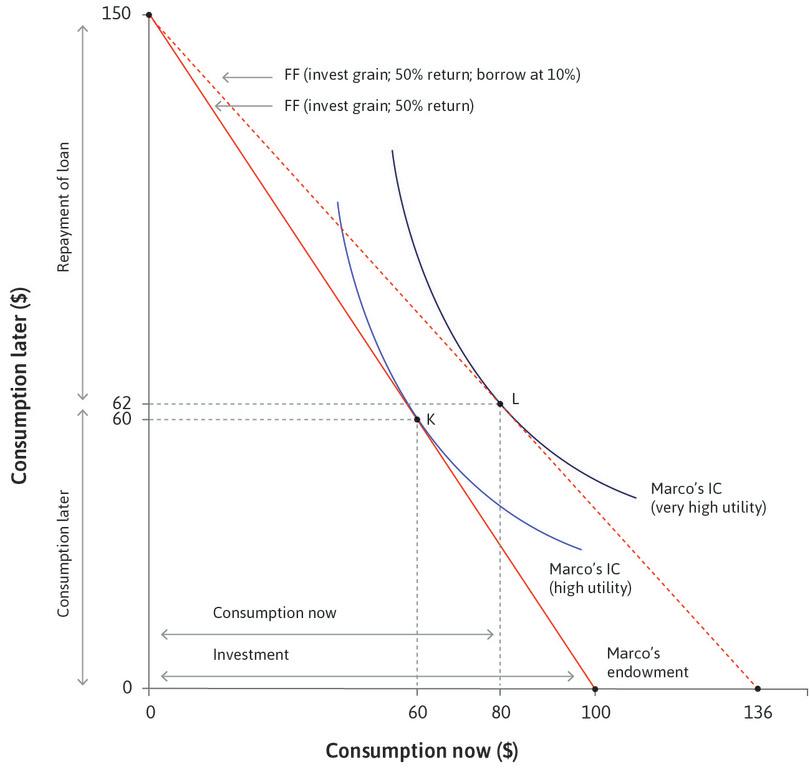
If Marco could get a loan at 10%, he would quickly see that he would be better off with an entirely new plan: invest everything he has, with a harvest next year of $150, but also borrow now in order to be able to consume more both now and in the future. This ‘invest-it-all’ plan is shown in Figure 10.8. The plan shifts Marco’s feasible frontier out even further, as shown by the dotted red line. Marco ends up consuming at a new point, L, with more both now and in the future.
Figure 10.9 summarizes how the ‘invest-it-all and borrow’ plan works compared to the other options.
| Plan (points in Figures 10.6 and 10.8) | Rate of return or interest | Consumption now, consumption later | Investment | Ranking by utility (or combined consumption) |
|---|---|---|---|---|
| Storage (H) | −20% (loss) | $68, $26 | n/a | Worst ($94) |
| Lending only (J) | 10% | $65, $39 | n/a | Third best ($104) |
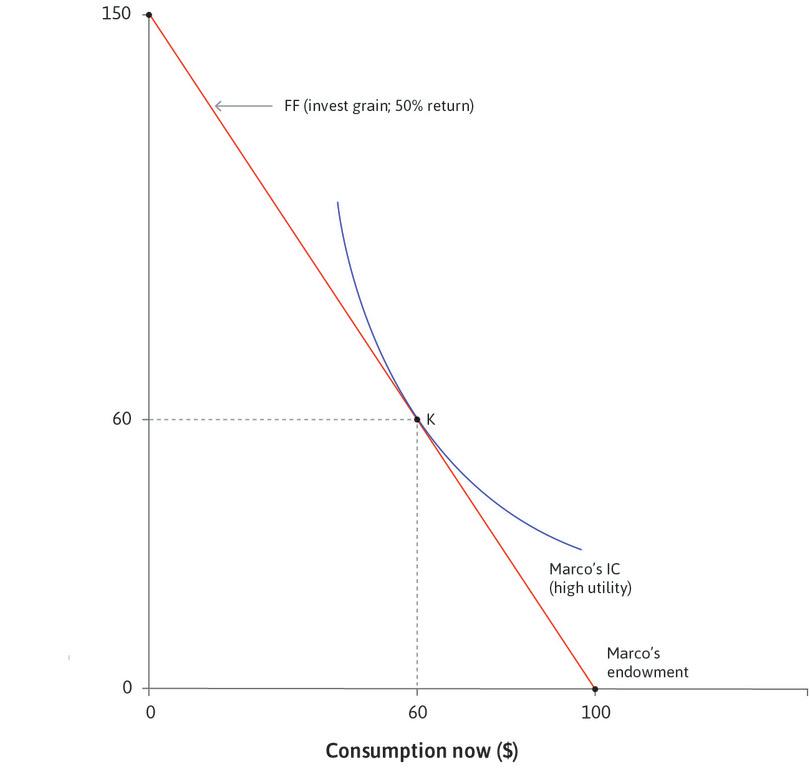
| Investment only (K) | 50% | $60, $60 | $40 | Second best ($120) |
| Investment and borrowing (L) | 50% (investment), −10% (lending) | $80, $62 | $100 | Best ($142) |
Storage, lending, investment, and borrowing provide Marco with many feasible sets.
Figure 10.9 Storage, lending, investment, and borrowing provide Marco with many feasible sets.
The feasible sets for all of Marco’s options are shown in Figure 10.10.
Let’s return to how Marco differs from Julia. Compare the feasible sets of Julia shown in Figure 10.4 and of Marco, whose options are shown in Figure 10.10.
Three differences between Marco and Julia explain the disparity in their outcomes.
- Marco starts with an asset while Julia starts with nothing: Julia has the prospect of a similar asset later, but this puts the two on opposite sides of the credit market.
- Marco has a productive investment opportunity while Julia does not.
- Marco and Julia may face different interest rates: The less-obvious difference is that if Marco (after investing his entire asset at a 50% return) wants to move his buying power forward in time, he borrows against his future income at a rate of 10%. Julia, lacking assets like the poor farmers in Chambar, may have no alternative but to borrow at the higher rate of 78%. The paradox is that Marco can borrow at a low interest rate because he does not need to borrow.
To summarize, borrowing, lending, storing, and investing are ways of moving goods consumption forward (to the present) or backwards (to the future) in time.
People engage in these activities because:
- They can increase their utility by smoothing consumption: Or, if they have pure impatience, by moving consumption to the present.
- They can increase their consumption in both periods: By lending, or investing.
People differ in which of these activities they engage (some borrowing, some lending) because:
- They have differences in their situation: For example, having an income now or later will affect their discount rates and their opportunities. Also, some have investment opportunities (like Marco), while others do not.
- They differ in their level of pure impatience.
Exercise 10.3 An increase in the interest rate
- Use a diagram like Figure 10.4 to show the income and the substitution effects of an increase in the interest rate for Marco who receives his endowment today.
- Compare these effects with those for Julia in Exercise 10.2 and explain your results.
Exercise 10.4 Lifetime income
Consider an individual’s income over his or her lifetime from leaving school to retirement. Explain how an individual may move from a situation like Julia’s to one like Marco’s over the course of their lifetime (assume that their pure impatience remains unchanged over their lifetime).
Question 10.5 Choose the correct answer(s)
Figure 10.6 depicts Marco’s choice of consumption in periods 1 (now) and 2 (later). He has $100 worth of grain in period 1 and no income in period 2. Marco has two choices. In scheme 1, he can store the grain that he does not consume in period 1. This results in a loss of 20% of the grain due to pests and rotting. In scheme 2, he can sell the grain that he does not consume and lend the money at 10%. Based on this information, which of the following statements is correct?
- Due to the loss of 20%, Marco is only able to consume 32 × 0.8 = $26 in period 2.
- He saves $32 which then increases in value by 10% to $35.20
- The MRT is 0.8 under scheme 1 and 1.1 under scheme 2.
- The budget constraint in scheme 2 is higher than in scheme 1 at any positive level of saving.
Question 10.6 Choose the correct answer(s)
Figure 10.10 depicts four possible feasible frontiers for Marco, who has $100 worth of grain in period 1 (now) and no income in period 2 (later). In scheme 1, he can store the grain that he does not consume in period 1. This results in 20% loss of the grain due to pests and rotting. In scheme 2, he can sell the grain that he does not consume and lend the money at 10%. In scheme 3, he can invest the remaining grain (for example by planting it as seed) for a return of 50%. Finally in scheme 4, he can invest the entire amount of grain and borrow against his future income at 10%. Based on this information, which of the following statements is correct?
- Marco is on a higher indifference curve at H than at his endowment point. Therefore he is better off.
- J is in the feasible set of schemes 2, 3 and 4. Therefore it can be attained under these three schemes. However, J is only optimal under scheme 2.
- With a higher rate of lending, the feasible frontier becomes steeper, pivoting from the point 100 on the horizontal axis. In particular, the intercept with the vertical axis will be higher than 110.
- 150 in period 2 is feasible whatever the interest rate so that point is fixed, but a higher interest rate implies that he can borrow less in period 1. So the budget constraint intersects the horizontal axis at less than 136, becoming steeper.
10.7 Assets, liabilities, and net worth
- balance sheet
- A record of the assets, liabilities, and net worth of an economic actor such as a household, bank, firm, or government.
We will see that a person’s wealth is an important aspect of their situation in the process of borrowing, lending, and investing, and that those with more wealth like Marco have opportunities not available to those with less wealth, like Julia. Balance sheets are an essential tool for understanding how wealth changes when an individual or a firm borrows and lends.
- asset
- Anything of value that is owned. See also: balance sheet, liability.
- liability
- Anything of value that is owed. See also: balance sheet, asset.
- net worth
- Assets less liabilities. See also: balance sheet, equity.
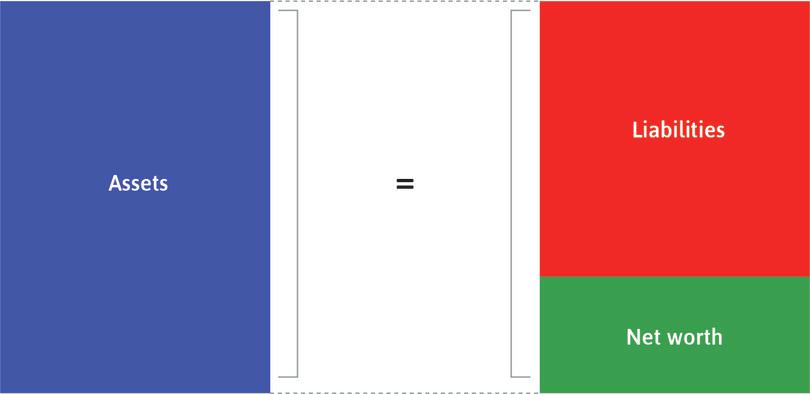
A balance sheet summarizes what the household or firm owns, and what it owes to others. What you own (including what you are owed by others) is called your assets, and what you owe others is called your liabilities (to be liable means to be responsible for something, in this case to repay your debts to others). The difference between your assets and your liabilities is called your net worth. The relationship between assets, liabilities, and net worth is shown in Figure 10.11.
When the components of an equation are such that by definition, the left-hand side is equal to the right-hand side, it is called an accounting identity, or identity for short. The balance sheet identity states:
Net worth is accumulated savings over time. We can also turn the identity around by subtracting liabilities from both sides, so that:
In the bathtub analogy, the water in the bathtub represents wealth as accumulated savings, and is the same as net worth. As we saw, net worth or wealth increases with income, and declines with consumption and depreciation. For a household, income increases bank deposits, while consumption is paid with bank deposits. Because bank deposits are an asset for their owner, these operations affect the asset side of the household’s balance sheet.
But your wealth or net worth does not change when you lend or borrow. This is because a loan creates both an asset and a liability on your balance sheet: if you borrow money you receive cash as an asset, while the debt is an equal liability.
Julia started off with neither assets nor liabilities and a net worth of zero, but on the basis of her expected future income she borrowed $58 when the interest rate was 10% (point E in Figure 10.4). At this time her asset is the $58 in cash that she is holding, while her liability is the loan that she has to pay back later. We record the value of the loan as $58 now, since that is what she received for getting into debt (her liability rises to $64 later only once interest has been added). This is why taking out the loan has no effect on her current net worth—the liability and the asset are equal to one another, so her net worth remains unchanged at zero. In Figure 10.12 this is recorded in her balance sheet under the heading ‘Now (before consuming)’.
She then consumes the $58—it flows out through the bathtub drain, to use our earlier analogy. Since she still has the $58 liability, her net worth falls to –$58. This is recorded in Figure 10.12 in her balance sheet under the heading ‘Now (after consuming)’.
Later, she receives income of $100 (an inflow to the bathtub). Also, because of accumulated interest, the value of her loan has risen to $64. So her net worth becomes $100 – $64 = $36. Again, we suppose that she then consumes the $36, leaving her with $64 in cash to pay off her debt of $64. At this point her net worth falls back to zero. The corresponding balance sheets are also shown in Figure 10.12.
Now – before consuming
| Julia's assets | Julia's liabilities | ||
|---|---|---|---|
| Cash | $58 | Loan | $58 |
Net worth = $58 − $58 = $0
Now – after consuming
| Julia's assets | Julia's liabilities | ||
|---|---|---|---|
| Cash | 0 | Loan | $58 |
Net worth = −$58
Later – before consuming
| Julia's assets | Julia's liabilities | ||
|---|---|---|---|
| Cash | $100 | Loan | $64 |
Net worth = $100 − $64 = $36
Later – after consuming
| Julia's assets | Julia's liabilities | ||
|---|---|---|---|
| Cash | $64 | Loan | $64 |
Net worth = 0
Julia’s balance sheets.
Figure 10.12 Julia’s balance sheets.
Question 10.7 Choose the correct answer(s)
The following diagram depicts Julia’s choice of consumption in periods 1 (now) and 2 (later) when the interest rate is 78%. She has no income in period 1 and an income of $100 in period 2. She chooses the consumption choice G. Based on this information, which of the following statements regarding Julia’s balance sheet is correct?
- The asset after borrowing but before consumption in period 1 is 35.
- The net worth after consumption in period 1 is –35, which is what she borrowed.
- The liability before consumption in period 2 is 62, which is the principal plus interest of her loan of 35 in period 1.
- Her income in period 2 is 100, of which she consumes 38, leaving 62 before she repays the loan.
10.8 Banks, money, and the central bank
Among the moneylenders in Chambar, the profitability of their lending business depends on:
- the cost of their borrowing
- the default rate on the loans they extended to farmers
- the interest rate they set
The closure of Irish banks for six months revealed how money can be created in an economy and how it depends on trust.
These case studies and the two-period model provide much of what we need in order to understand the role of the financial system in the economy. But we must introduce two more actors on the economic stage: banks and the central bank.
- bank
- A firm that creates money in the form of bank deposits in the process of supplying credit.
A bank is a firm that makes profits through its lending and borrowing activities. The terms on which banks lend to households and firms differ from their borrowing terms. The interest they pay on deposits is lower than the interest they charge when they make loans, and this allows banks to make profits.
To explain this process, we first have to explore in more detail the concept of money.
Types of money
Money is a medium of exchange used to purchase goods or services. It can take the form of bank notes, bank deposits, or whatever else one purchases things with.
- Base money (also known as legal tender): Cash and the balances held by commercial banks in their accounts at the central bank, known as reserves.
- Bank money: Money in the form of bank deposits created by commercial banks when they extend credit to firms and households.
- Broad money: The stock of money in circulation, which is the sum of base money (excluding legal tender held by banks) and bank money.
- central bank
- The only bank that can create a country’s legal tender. Usually part of the government. Commercial banks have accounts at this bank, holding legal tender.
We saw that anything that is accepted as payment can be counted as money. But money in this sense is different from legal tender, which is also called base money or high-powered money. Unlike bank deposits or cheques, legal tender has to be accepted as payment by law. It comprises cash (notes and coins) and accounts held by commercial banks at the central bank, called commercial bank reserves. Reserves are equivalent to cash because a commercial bank can always take out reserves as cash from the central bank, and the central bank can always print any cash it needs to provide. As we will see, this is not the case with accounts held by households or businesses at commercial banks—commercial banks do not necessarily have the cash available to satisfy all their customers’ needs.
Most of what we count as money is not legal tender issued by the central bank, but instead is created by commercial banks when they make loans. We explain using bank balance sheets.
Unlike our earlier example in which a bank deposit arises from a loan, let us suppose in this case that Marco has $100 in cash and he puts it in a bank account in Abacus Bank. Abacus Bank will put the cash in a vault, or it will deposit the cash in its account at the central bank. Abacus Bank’s balance sheet gains $100 of base money as an asset, and a liability of $100 that is payable on demand to Marco, as shown in Figure 10.13a.
| Abacus Bank's assets | Abacus Bank's liabilities | ||
|---|---|---|---|
| Base money | $100 | Payable on demand to Marco | $100 |
Marco deposits $100 in Abacus Bank.
Figure 10.13a Marco deposits $100 in Abacus Bank.
Marco wants to pay $20 to his local grocer, Gino, in return for groceries, so he instructs Abacus Bank to transfer the money to Gino’s account in Bonus Bank (he could do this by paying Gino using a debit card). This is shown on the balance sheets of the two banks in Figure 10.13b: Abacus Bank’s assets and liabilities both go down by $20, while Bonus Bank’s assets are increased by this addition of $20 of base money, and its liabilities increase by $20 payable on demand to Gino.
| Abacus Bank's assets | Abacus Bank's liabilities | ||
|---|---|---|---|
| Base money | $80 | Payable on demand to Marco | $80 |
| Bonus Bank's assets | Bonus Bank's liabilities | ||
|---|---|---|---|
| Base money | $20 | Payable on demand to Gino | $20 |
Marco pays $20 to Gino.
Figure 10.13b Marco pays $20 to Gino.
This illustrates the payment services provided by banks. So far we have just considered transactions using base money, or legal tender. We now show how banks create money in the process of making loans.
Suppose that Gino borrows $100 from Bonus Bank. Bonus Bank lends him the money by crediting his bank account with $100, so he is now owed $120. But he owes a debt of $100 to the bank. So Bonus Bank’s balance sheet has expanded. Its assets have grown by the $100 it is owed by Gino, and its liabilities have grown by the $100 it has credited to his bank account, shown in Figure 10.13c.
| Bonus Bank's assets | Bonus Bank's liabilities | ||
|---|---|---|---|
| Base money | $20 | Payable on demand to Gino | $120 |
| Bank loan | $100 | ||
| Total | $120 | ||
Bonus Bank gives Gino a loan of $100.
Figure 10.13c Bonus Bank gives Gino a loan of $100.
Bonus Bank has now expanded the money supply: Gino can make payments up to $120, so in this sense the money supply has grown by $100—even though base money has not grown. The money created by his bank is called bank money.
Base money remains essential, however, partly because customers sometimes take out cash, but also because when Gino wants to spend his loan, his bank has to transfer base money. Suppose Gino employs Marco to work in his shop, and pays him $10. Then Bonus Bank has to transfer $10 of base money from Gino’s bank account to Marco’s bank account in Abacus Bank. This transaction is shown in Figure 10.13d.
| Abacus Bank's assets | Abacus Bank's liabilities | ||
|---|---|---|---|
| Base money | $90 | Payable on demand to Marco | $90 |
| Bonus Bank's assets | Bonus Bank's liabilities | ||
|---|---|---|---|
| Base money | $10 | Payable on demand to Gino | $110 |
| Bank loan | $100 | ||
| Total | $110 | ||
Gino pays Marco $10.
Figure 10.13d Gino pays Marco $10.
In practice, banks make many transactions to one another in a given day, most cancelling each other out, and they settle up at the end of each day. So at the end of each day, each bank will transfer or receive the net amount of transactions they have made. This means they do not need to have available the legal tender to cover all transactions or demand for cash.
Note that if Marco and Gino were customers of the same bank, there will be no loss of base money. This is one reason why banks fight to get a larger share of deposits.
Because of the loan, the total ‘money’ in the banking system has grown, as Figure 10.13e shows.
| Abacus Bank and Bonus Bank's assets | Abacus Bank and Bonus Bank's liabilities | ||
|---|---|---|---|
| Base money | $100 | Payable on demand | $200 |
| Bank loan | $100 | ||
| Total | $200 | ||
The total money in the banking system has grown.
Figure 10.13e The total money in the banking system has grown.
Creating money may sound like an easy way to make profits, but the money banks create is a liability, not an asset, because it has to be paid on demand to the borrower. It is the corresponding loan that is an asset for the bank. Banks make profits out of this process by charging interest on the loans. So if Bonus Bank lends Gino the $100 at an interest rate of 10%, then next year the bank’s liabilities have fallen by $10 (the interest paid on the loan, which is a fall in Gino’s deposits). This income for the bank increases its accumulated profits and therefore its net worth by $10. Since net worth is equal to the value of assets minus the value of liabilities, this allows banks to create positive net worth.
Base money (excluding legal tender held by banks) plus bank money is called broad money. Broad money is money in the hands of the non-bank public.
The ratio of base money to broad money varies across countries and over time. For example, before the financial crisis, base money comprised about 3–4% of broad money in the UK, 6–8% in South Africa, and 8–10% in China.
- maturity transformation
- The practice of borrowing money short-term and lending it long-term. For example, a bank accepts deposits, which it promises to repay at short notice or no notice, and makes long-term loans (which can be repaid over many years). Also known as: liquidity transformation
- mortgage (or mortgage loan)
- A loan contracted by households and businesses to purchase a property without paying the total value at one time. Over a period of many years, the borrower repays the loan, plus interest. The debt is secured by the property itself, referred to as collateral. See also: collateral.
- liquidity risk
- The risk that an asset cannot be exchanged for cash rapidly enough to prevent a financial loss.
- default risk
- The risk that credit given as loans will not be repaid.
By taking deposits and making loans, banks provide the economy with the service of maturity transformation. Bank depositors (individuals or firms) can withdraw their money from the bank without notice. But when banks lend, they give a fixed date on which the loan will be repaid, which in the case of a mortgage loan for a house purchase, may be 30 years in the future. They cannot require the borrower to repay sooner, which allows those receiving bank loans to engage in long-term planning. This is called maturity transformation because the length of a loan is termed its maturity, so the bank is engaging in short-term borrowing and long-term lending. It is also called liquidity transformation: The lenders’ deposits are liquid (free to flow out of the bank on demand) whereas bank loans to borrowers are illiquid.
While maturity transformation is an essential service in any economy, it also exposes the bank to a new form of risk (called liquidity risk), aside from the possibility that its loans will not be repaid (called default risk).
- bank run
- A situation in which depositors withdraw funds from a bank because they fear that it may go bankrupt and not honour its liabilities (that is, not repay the funds owed to depositors).
Banks make money by lending much more than they hold in legal tender, because they count on depositors not to need their funds all at the same time. The risk they face is that depositors can all decide they want to withdraw money instantaneously, but the money won’t be there. In Figure 10.13e, the banking system owed $200 but only held $100 of base money. If all customers demanded their money at once, the banks would not be able to repay. This is called a bank run. If there’s a run, the bank is in trouble. Liquidity risk is a cause of bank failures.
Once people become frightened that a bank is experiencing a shortage of liquidity, there will be a rush to be the first to withdraw deposits. If everyone tries to withdraw their deposits at once, the bank will be unable to meet their demands because it has made long-term loans that cannot be called in at short notice.7
Like any other firm in a capitalist system, banks can also fail by making bad investments, such as by giving loans that do not get paid back. But in some cases, banks are so large or so deeply involved throughout the financial system that governments decide to rescue them if they are at risk of going bankrupt. This is because, unlike the failure of a firm, a banking crisis can bring down the financial system as a whole and threaten the livelihoods of people throughout the economy. In Unit 17 we will see how bank failures were involved in the global financial crisis of 2008.
Question 10.8 Choose the correct answer(s)
Which of the following statements is correct?
- Money is a medium of exchange used to purchase goods and services, but it can also take the form of cheques and credits, as well as coins and notes.
- Bank money is the money created by commercial banks when they extend credit to firms and households.
- Broad money is base money created by the central bank plus bank money created by commercial banks.
- Liquidity transformation occurs when the banks transform liquid deposits into illiquid loans.
10.9 The central bank, the money market, and interest rates
- interest rate (short-term)
- The price of borrowing base money.
Commercial banks make money out of banking services and loans. But for that they need to be able to make transactions, for which they need base money. There is no automatic relationship between the amount of base money they require and the amount of lending they do. Rather, they need whatever amount of base money will cover the net transactions they have to make on a daily basis. The price of borrowing base money is the short-term interest rate.
Suppose in the above example that Gino wants to pay $50 to Marco (and there are no other transactions that day). Gino’s bank, Bonus Bank, doesn’t have enough base money to make the transfer to Abacus Bank, as we can see from its balance sheet in Figure 10.13f.
| Bonus Bank's assets | Bonus Bank's liabilities | ||
|---|---|---|---|
| Base money | $20 | Payable on demand to Gino | $120 |
| Bank loan | $100 | ||
| Total | $120 | ||
Bonus Bank does not have enough base money to pay $50 to Abacus Bank.
Figure 10.13f Bonus Bank does not have enough base money to pay $50 to Abacus Bank.
So Bonus Bank has to borrow $30 of base money to make the payment. Banks borrow from each other in the money markets since, at any moment, some banks will have excess money in their bank account, and others not enough. They could try to induce someone to deposit additional money in another bank account, but deposits also have costs due to interest payments, marketing, and maintaining bank branches. Thus, cash deposits are only one part of bank financing.
But what determines the price of borrowing in the money market (the interest rate)? We can think in terms of supply and demand:
The demand for base money depends on how many transactions commercial banks have to make.
The supply of base money is simply a decision by the central bank.
Since the central bank controls the supply of base money, it can also decide the interest rate. The central bank intervenes in the money market by saying it will lend whatever quantity of base money is demanded at the interest rate (i) that it chooses.
The technicalities of how the central bank implements its chosen policy interest rate vary among central banks around the world. The details can be found on each central bank’s website.
- policy (interest) rate
- The interest rate set by the central bank, which applies to banks that borrow base money from each other, and from the central bank. Also known as: base rate, official rate. See also: real interest rate, nominal interest rate.
Banks in the money market will respect that price: no bank will borrow at a higher rate or lend at a lower rate, since they can borrow at rate i from the central bank. This i is also called the base rate, official rate or policy rate.
- lending rate (bank)
- The average interest rate charged by commercial banks to firms and households. This rate will typically be above the policy interest rate: the difference is the markup or spread on commercial lending. Also known as: market interest rate. See also: interest rate, policy rate.
The base rate applies to banks that borrow base money from each other, and from the central bank. But it matters in the rest of the economy because of its knock-on effect on other interest rates. The average interest rate charged by commercial banks to firms and households is called the bank lending rate. This rate will typically be above the policy interest rate, to ensure that banks make profits (it will also be higher for borrowers perceived as risky by the bank, as we saw earlier). The difference between the bank lending rate and the base rate is the markup or spread on commercial lending.
In the UK, for example, the policy interest rate set by the Bank of England was 0.5% in 2014, but few banks would lend at less than 3%. In emerging economies this gap can be quite large, owing to the uncertain economic environment. In Brazil, for instance, the central bank policy rate in 2014 was 11% but the bank lending rate was 32%.
The central bank does not control this markup, but generally the bank lending rate goes up and down with the base rate, just as other firms typically vary their prices according to their costs.
- government bond
- A financial instrument issued by governments that promises to pay flows of money at specific intervals.
- yield
- The implied rate of return that the buyer gets on their money when they buy a bond at its market price.
- present value
- The value today of a stream of future income or other benefits, when these are discounted using an interest rate or the person’s own discount rate. See also: net present value.
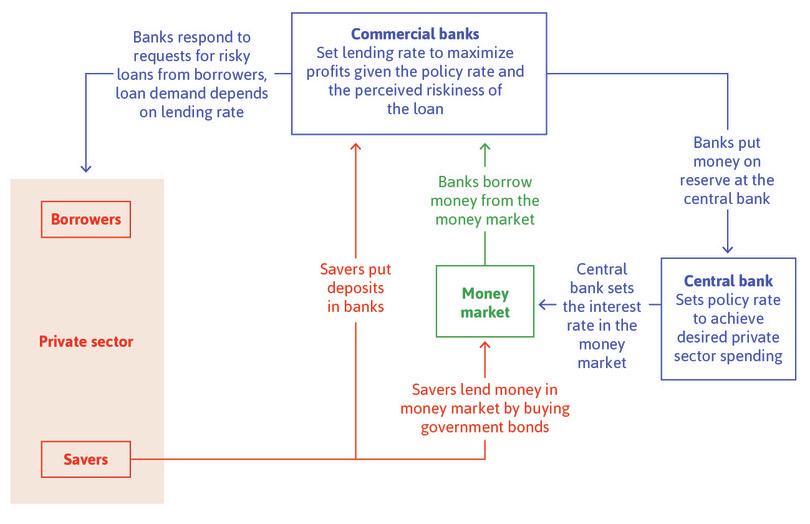
Figure 10.14 greatly simplifies the financial system. In this model, we show savers facing just two choices: to deposit money in a bank current account, which we assume pays no interest, or buy government bonds in the money market. The interest rate on government bonds is called the yield. Read the Einstein at the end of this section for an explanation of these bonds, and why the yield on government bonds is close to the policy interest rate. We also give an explanation of what are called present value calculations, which are essential for you to understand how assets like bonds are priced.
Banks, the central bank, borrowers, and savers.
Figure 10.14 Banks, the central bank, borrowers, and savers.
Adapted from Figure 5.12 in Chapter 5 of Wendy Carlin and David Soskice. 2015. Macroeconomics: Institutions, Instability, and the Financial System. Oxford: Oxford University Press.
We have now seen a model of how the central bank sets the policy interest rate and how this affects the lending interest rate. But why should a central bank do this at all? To understand the role of the central bank, we must look at two questions:
- How does the lending rate affect spending in the economy? We will answer this question in Section 10.11.
- Why does the central bank wish to affect spending by changing the interest rate (as mentioned in Figure 10.14)? We will answer this much larger question in Units 13–15, when we explain fluctuations in employment and inflation in the economy as a whole, and reasons why central banks are frequently given responsibility for moderating those fluctuations by changing the interest rate.
Exercise 10.5 Interest rate markups
Use the websites of two central banks of your choice to collect data on the monthly policy interest rate and the mortgage interest rate between 2000 and the most recent year available.
- Plot the data, with the date on the horizontal axis and the interest rate on the vertical axis.
- How does the banking markup (interest rate margin) compare between the two countries?
- Do banking markups change over time? Suggest possible reasons for what you observe.
Einstein Present value (PV)
Assets like shares in companies, bank loans, or bonds typically provide a stream of income in the future. Since these assets are bought and sold, we have to ask the question: how do we value a stream of future payments? The answer is the present value (PV) of the expected future income.
To make this calculation, we have to assume that people participating in the market to buy and sell assets have the capability to save and borrow at a certain interest rate. So, imagine you face an interest rate of 6% and are offered a financial contract that says you will be paid €100 in one year’s time. That contract is an asset. How much would you be willing to pay for it today?
You would not pay €100 today for the contract, because if you had €100 today, you could put it in the bank and get €106 in a year’s time, which would be better than buying the asset.
Imagine you are offered the asset for €90 today. Now you will want to buy it, because you could borrow €90 today from the bank at 6%, and in a year’s time you would pay back €95.40 while you receive €100 from the asset, making a profit of €4.60.
The break-even price (PV) for this contract would make you indifferent between buying the contract and not buying it. It has to be equal to whatever amount of money would give you €100 in a year’s time if you put it in the bank today. With an interest rate of 6%, that amount is:
€94.34 today is worth the same to you as €100 in a year’s time, because if you put €94.34 in the bank, then it would be worth €100 in a year. Equivalently, if you borrowed €94.34 today from the bank to buy the asset, you would have to pay back €100 in a year’s time, exactly offsetting the €100 the asset gives you.
We say that the income next year is discounted by the interest rate: a positive interest rate makes it worth less than income today.
The same logic applies further in the future, where we allow for interest compounding over time. If you receive €100 in t years time, then today its value to you is:
Now suppose an asset gives a payment each year for T years, paying Xt in year t, starting next year in year 1. Then each payment Xt has to be discounted according to how far in the future it is. So with an interest rate of i the PV of this asset is:
The present value of these payments obviously depends on the amounts of the payments themselves. But it also depends on the interest rate: if the interest rate increases, then the PV will decline, because future payments are discounted (their PV reduced) by more. Note that it is easy to adjust the present value formula to take into account different interest rates for years 1, 2, and so on.
Net present value (NPV)
This logic applies to any asset that provides income in the future. So if a firm is considering whether or not to make an investment, they have to compare the cost of making the investment with the present value of the profits they expect it to provide in the future. In this context we consider the net present value (NPV), which takes into account the cost of making the investment as well as the expected profits. If the cost is c and the present value of the expected profits is PV, then the NPV of making the investment is:
If this is positive then the investment is worth making, because the expected profits are worth more than the cost (and vice versa).
Bond prices and yields
A bond is a particular kind of financial asset, where the bond issuer promises to pay a given amount over time to the bondholder. Issuing or selling a bond is equivalent to borrowing, because the bond issuer receives cash today and promises to repay in the future. Conversely, a bond buyer is a lender or saver, because the buyer gives up cash today, expecting to be repaid in the future. Both governments and firms borrow by issuing bonds. Households buy bonds as a form of saving both directly and indirectly through pension funds.
Bonds typically last a predetermined amount of time, called the maturity of the bond, and provide two forms of payment: the face value F, which is an amount paid when the bond matures, and a fixed payment every period (for example, every year or every 3 months) until maturity. In the past, bonds were physical pieces of paper and when one of the fixed payments was redeemed, a coupon was clipped from the bond. For this reason, the fixed payments are called coupons and we label them C.
As we saw in the calculation of PV, the amount that a lender will be willing to pay for a bond will be its present value, which depends on the bond’s face value, the series of coupon payments, and also on the interest rate. No one will buy a bond for more than its present value because they would be better off putting their money in the bank. No one will sell a bond for less than its present value, because they would be better off borrowing from the bank. So:
Or, for a bond with a maturity of T years:
An important characteristic of a bond is its yield. This is the implied rate of return that the buyer gets on their money when they buy the bond at its market price. We calculate the yield using an equation just like the PV equation. The yield y will solve the following:
If the interest rate stays constant, as we have assumed, then the yield will be the same as that interest rate. But in reality, we cannot be sure how interest rates are going to change over time. In contrast, we know the price of a bond, its coupon payments, and its face value, so we can always calculate a bond’s yield. Buying a bond with yield y is equivalent to saving your money at the guaranteed constant interest rate of i = y.
- arbitrage
- The practice of buying a good at a low price in a market to sell it at a higher price in another. Traders engaging in arbitrage take advantage of the price difference for the same good between two countries or regions. As long as the trade costs are lower than the price gap, they make a profit. See also: price gap.
Since a saver (a lender) can choose between buying a government bond, lending the money in the money market, or putting it into a bank account, the yield on the government bond will be very close to the rate of interest in the money market. If it weren’t, money would be switched very quickly from one asset to the other by traders until the rates of return were equalized, a strategy called arbitrage.
Let’s take a numerical example: a government bond with a face value of €100, yearly coupon of €5, and a maturity of 4 years. The nominal interest rate in the money market is 3%, and we use this to discount the cash flows we receive.
So the price of this bond is given by:
We would be willing to pay at most €107.43 for this bond today, even though it generates €120 of revenue over four years. The yield is equal to the interest rate of 3%. If the central bank raises the policy interest rate, then this will reduce the market price of the bond, increasing the yield in line with the interest rate.
10.10 The business of banking and bank balance sheets
To understand the business of banking in more detail, we can look at a bank’s costs and revenues:
- The bank’s operational costs: These include the administration costs of making loans. For example, the salaries of loan officers who evaluate loan applications, the costs of renting and maintaining a network of branches and call centres used to supply banking services.
- The bank’s interest costs: Banks must pay interest on their liabilities, including deposits and other borrowing.
- The bank’s revenue: This is the interest on and repayment of the loans it has extended to its customers.
- The bank’s expected return: This is the return on the loans it provides, taking into account the fact that not all customers will repay their loans.
Like moneylenders, if the risk of making loans (the default rate) is higher, then there will be a larger gap (or spread or markup) between the interest rate banks charge on the loans they make and the cost of their borrowing.
The profitability of the business depends on the difference between the cost of borrowing and the return to lending, taking account of the default rate and the operational costs of screening the loans and running the bank.
A good way to understand a bank is to look at its entire balance sheet, which summarizes its core business of lending and borrowing. Banks borrow and lend to make profits:
- Bank borrowing is on the liabilities side: Deposits, and borrowing (secured and unsecured) are recorded as liabilities.
- Bank lending is on the assets side.
| Assets (owned by the bank or owed to it) | % of balance sheet | Liabilities (what the bank owes households, firms and other banks) | % of balance sheet | ||||
|---|---|---|---|---|---|---|---|
| Cash reserve balances at the central bank (1) | Owned by the bank: immediately accessible funds | 2 | Deposits (1) | Owned by households and firms | 50 | ||
| Financial assets, some of which (government bonds) may be used as collateral for borrowing) (2) | Owned by the bank | 30 | Secured borrowing (collateral provided) (2) | Includes borrowing from other banks via the money market | 30 | ||
| Loans to other banks (3) | Via the money market | 11 | Unsecured borrowing (no collateral provided) (3) | 16 | |||
| Loans to households (4) | 55 | ||||||
| Fixed assets such as buildings and equipment (5) | Owned by the bank | 2 | |||||
| Total assets | 100 | Total liabilities | 96 | ||||
| Net worth = total assets − total liabilities = equity (4) | 4 | ||||||
A simplified bank balance sheet.
Figure 10.15 A simplified bank balance sheet.
Adapted from Figure 5.9 in Chapter 5 of Wendy Carlin and David Soskice. 2015. Macroeconomics: Institutions, Instability, and the Financial System. Oxford: Oxford University Press.
As we saw above:
Another way of saying this is that the net worth of a firm, like a bank, is equal to what is owed to the shareholders or owners. This explains why net worth is on the liabilities side of the balance sheet. If the value of the bank’s assets is less than the value of what the bank owes others, then its net worth is negative, and the bank is insolvent.
- insolvent
- An entity is this if the value of its assets is less than the value of its liabilities. See also: solvent.
Let’s examine the asset side of the bank balance sheet:
- (1) Cash and central bank reserves: Item 1 on the balance sheet is the cash it holds, plus the bank’s balance in its account at the central bank, called its reserve balances. Cash and reserves at the central bank are the bank’s readily accessible, or liquid, funds. This is base money and amounts to a tiny fraction of the bank’s balance sheet—just 2% in this example of a typical contemporary bank. As we saw above, money created by the central bank is a very small proportion of the broad money that circulates in the economy.
- (2) Bank’s own financial assets: These assets can be used as collateral for the bank’s borrowing in the money market. As we discussed above, they borrow to replenish their cash balances (item 1, Figure 10.15) when depositors withdraw (or transfer) more funds than the bank has available.
- (3) Loans to other banks: A bank will also have loans to other banks on its balance sheet.
- (4) Loans to households and firms: The bank’s lending activities are the largest item on the asset side. The loans made by the bank to households and firms make up 55% of the balance sheet in Figure 10.15. This is the bank’s core business. Some of this will be secured lending. A loan is secured if the borrower has provided collateral. In the case of housing loans, called mortgages, the value of the house is the collateral. Other bank loans are unsecured, like overdrafts, credit card balances, and consumer loans.
- (5) Bank assets such as buildings and equipment will be recorded on the asset side of the balance sheet.
On the liability side of the bank balance sheet, there are three forms of bank borrowing, shown in Figure 10.15:
- (1) The most important one is bank deposits, making up 50% of the bank’s balance sheet in this example. The bank owes these to households and firms. As part of its profit-maximization decision, the bank makes a judgement about the likely demand by depositors to withdraw their deposits. Across the banking system withdrawals and deposits occur continuously, and when the cross-bank transactions are cleared, most cancel each other out. Any bank must ensure that it has cash and reserves at the central bank to meet the demand by depositors for funds, and the net transfers they have made that day. Holding cash and reserves for this purpose has an opportunity cost, because those funds could instead be lent out in the money market in order to earn interest, so banks aim to hold the minimum prudent balances of cash and reserves.
(2) and (3) on the liabilities side of the balance sheet are what the bank has borrowed from households, firms, and other banks in the money market.
- Some of this is secured borrowing: The bank provides collateral using its financial assets (which appear on the left-hand side of the balance sheet in item (2)).
- Some borrowing is unsecured.
Item (4) on the balance sheet is the bank’s net worth. This is the bank’s equity. It comprises the shares issued by the bank and the accumulated profits, which have not been paid out as dividends to shareholders over the years. For a typical bank, its equity is only a few per cent of its balance sheet. The bank is a very debt-heavy company.
We can see this from real-world examples illustrated in Figures 10.16 and 10.17.
Figure 10.16 shows the simplified balance sheet of Barclays Bank (just before the financial crisis) and Figure 10.17 shows the simplified balance sheet of a company from the non-financial sector, Honda.
| Assets | Liabilities | ||
|---|---|---|---|
| Cash reserve balances at the central bank | 7,345 | Deposits | 336,316 |
| Wholesale reserve repo lending | 174,090 | Wholesale repo borrowing secured with collateral | 136,956 |
| Loans (for example mortgages) | 313,226 | Unsecured borrowing | 111,137 |
| Fixed assets (for example buildings, equipment) | 2,492 | Trading portfolio liabilities | 71,874 |
| Trading portfolio assets | 177,867 | Derivative financial instruments | 140,697 |
| Derivative financial instruments | 138,353 | Other liabilities | 172,417 |
| Other assets | 183,414 | ||
| Total assets | 996,787 | Total liabilities | 969,397 |
| Net worth | |||
| Equity | 27,390 | ||
| Memorandum item: Leverage ratio (total assets/net worth) | 996,787/27,390 = 36.4 |
Barclays Bank’s balance sheet in 2006 (£m).
Figure 10.16 Barclays Bank’s balance sheet in 2006 (£m).
Barclays Bank. 2006. Barclays Bank PLC Annual Report. Also presented as Figure 5.10 in Chapter 5 of Wendy Carlin and David Soskice. 2015. Macroeconomics: Institutions, Instability, and the Financial System. Oxford: Oxford University Press.
| Assets | Liabilities | ||
|---|---|---|---|
| Current assets | 5,323,053 | Current liabilities | 4,096,685 |
| Finance subsidiaries-receivables, net | 2,788,135 | Long-term debt | 2,710,845 |
| Investments | 668,790 | Other liabilities | 1,630,085 |
| Property on operating leases | 1,843,132 | ||
| Property, plant and equipment | 2,399,530 | ||
| Other assets | 612,717 | ||
| Total assets | 13,635,357 | Total liabilities | 8,437,615 |
| Net worth | |||
| Equity | 5,197,742 | ||
| Memorandum item: Leverage ratio as defined for banks (total assets/net worth) | 13,635,357/5,197,742 = 2.62 |
| Memorandum item: Leverage ratio as defined for non-banks (total liabilities/total assets) | 8,437,615/13,635,357 = 61.9% |
Honda Motor Company’s balance sheet in 2013 (¥m).
Figure 10.17 Honda Motor Company’s balance sheet in 2013 (¥m).
Honda Motor Co. 2013. Annual Report.
- leverage ratio (for banks or households)
- The value of assets divided by the equity stake in those assets.
Current assets refers to cash, inventories, and other short-term assets. Current liabilities refer to short-term debts and other pending payments.
A way of describing the reliance of a company on debt is to refer to its leverage ratio or gearing.
Leverage for non-banks
This is defined differently from leverage for banks. For companies, the leverage ratio is defined as the value of total liabilities divided by total assets. For an example of the use of the leverage definition for non-banks, see: Marina-Eliza Spaliara. 2009. ‘Do Financial Factors Affect the Capital–labour Ratio? Evidence from UK Firm-Level Data’. Journal of Banking & Finance 33 (10) (October): pp. 1932–1947.
Unfortunately the term leverage ratio is defined differently for financial and non-financial companies (both definitions are shown in Figures 10.16 and 10.17). Here, we calculate the leverage for Barclays and Honda using the definition used for banks: total assets divided by net worth. Barclays’ total assets are 36 times their net worth. This means that given the size of its liabilities (its debt), a very small change in the value of its assets (1/36 ≈ 3%) would be enough to wipe out its net worth and make the bank insolvent. By contrast, using the same definition we see that Honda’s leverage is less than three. Compared to Barclays, Honda’s equity is far higher in relation to its assets. Another way to say this is that Honda finances its assets by a mixture of debt (62%) and equity (38%), whereas Barclays finances its assets with 97% debt and 3% equity.
Question 10.9 Choose the correct answer(s)
The following example is a simplified balance sheet of a commercial bank. Based on this information, which of the following statements is correct?
| Assets | Liabilities | ||
|---|---|---|---|
| Cash and reserves | £2m | Deposits | £45m |
| Financial assets | £27m | Secured borrowing | £32m |
| Loans to other banks | £10m | Unsecured borrowing | £20m |
| Loans to households and firms | £55m | ||
| Fixed assets | £6m | ||
| Total assets | £100m | Total liabilities | £97m |
- The base money is cash plus reserves at the central bank. It does not include the financial assets.
- Secured borrowing is bank’s borrowing with collateral, using its financial assets. It has positive default risk (hence collateral).
- The bank’s net worth is its assets – liabilities = £3 million.
- Leverage is net worth divided by assets, here £3 million/£100 million = 33.3.
10.11 The central bank’s policy rate can affect spending
Households and firms borrow to spend: the more it costs to borrow (equivalently, the higher the interest rate), the less they spend now. This allows the central bank to influence the amount of spending in the economy, which then affects firms’ decisions about how many people to employ and what prices to set. In this way, the central bank can affect the level of unemployment and inflation (rising prices), as we shall see in detail in Units 13 to 15.
To see the effect of a lower interest rate on consumption spending, we return to Julia, who has no wealth, but expects to receive $100 one year from now. Use the analysis in Figure 10.18 to see how the interest rate affects her decision over how much to spend now.
In many rich countries, when people borrow it is most often to purchase a car or a home (mortgages for housing are less common in countries where financial markets are less developed). Loans for this purpose are readily available even to people of limited wealth because, unlike loans to purchase food or daily consumption items, mortgage loans purchase a car or house that can be signed over to the bank as collateral. This insures the bank against default risk. For this reason, an important channel for the effects of the interest rate on domestic spending in many rich economies is through its effect on home purchases and consumer durables such as automobiles. The interest rates set by central banks can help to moderate ups and downs in spending on housing and consumer durables, and so smooth out the fluctuations in the whole economy.
Question 10.10 Choose the correct answer(s)
The following diagram depicts Julia’s choice of consumptions in periods 1 (now) and 2 (later) under different interest rates. She has no income in period 1 but an income in period 2 against which she can borrow. Based on this information, which of the following statements are correct?
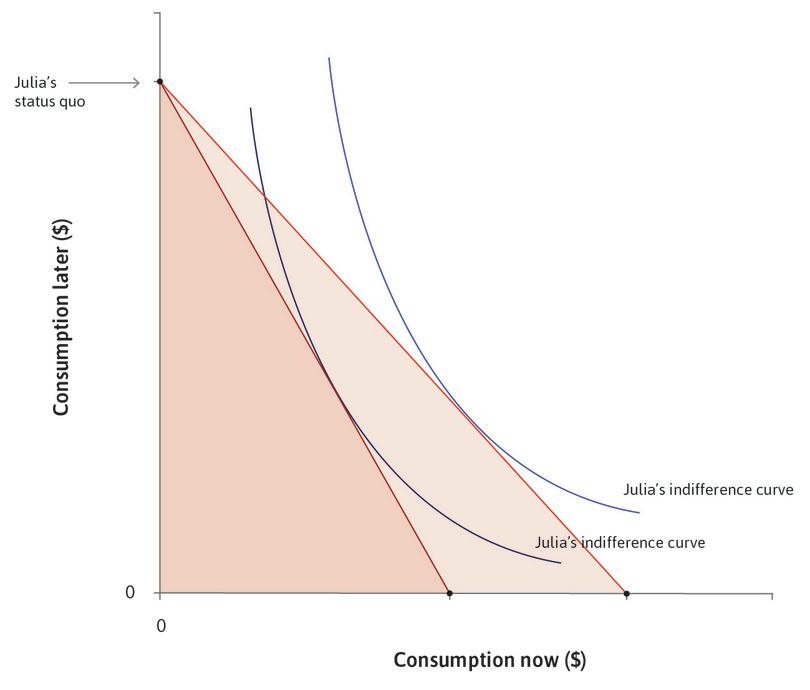
- The marginal rate of transformation is one plus the interest rate. Hence it decreases with an interest rate cut.
- The interest rate cut increases Julia’s income and also makes present consumption cheaper relative to future consumption, so both the income and substitution effects lead her to increase consumption in period 1.
- The substitution effect of the rate cut will lead Julia to decrease her consumption in period 2. The income effect of the rate cut will lead her to increase her consumption in period 2. The net effect is therefore ambiguous.
- We know from (b) that consumption in period 1 increases as the interest rate goes down, so consumption in period 1 is decreasing in the interest rate, meaning that the graph is downward sloping.
Exercise 10.6 Interest rates and consumption spending
Think about the income and substitution effects of a rise in the interest rate, as analysed in Exercise 10.2 and 10.3. Comment on whether a rise in the interest rate would be expected to reduce consumption expenditure in an economy in which a proportion of households are like Julia, and a proportion are like Marco.
10.12 Credit market constraints: A principal-agent problem
Lending is risky. A loan is made now and has to be repaid in the future. Between now and then, unanticipated events beyond the control of the borrower can occur. If the crops in Chambar, Pakistan were destroyed by bad weather or disease, the moneylenders would not be repaid even though the farmers were hard-working. The obsolescence of the skill you have invested in using your student loan is an unavoidable risk, and will mean the loan may not be repaid. The interest rate set by a bank or a moneylender would be greater if the default risk due to unavoidable events was greater.
But lenders face two further problems. When loans are taken out for investment projects, the lender cannot be sure that a borrower will exert enough effort to make the project succeed. Moreover, often the borrower has more information than the lender about the quality of the project and its likelihood of success. Both of these problems arise from the difference between the information the borrower and the lender have about the borrower’s project and actions.
- principal-agent relationship
- This relationship exists when one party (the principal) would like another party (the agent) to act in some way, or have some attribute that is in the interest of the principal, and that cannot be enforced or guaranteed in a binding contract. See also: incomplete contract. Also known as: principal-agent problem.
- collateral
- An asset that a borrower pledges to a lender as a security for a loan. If the borrower is not able to make the loan payments as promised, the lender becomes the owner of the asset.
This creates a conflict of interest. If the project doesn’t succeed because the borrower made too little effort, or because it just wasn’t a good project, the lender loses money. If the borrower were using only her own money, it is likely that she would have been more conscientious or maybe not engaged in the project at all.
The relationship between the lender and the borrower is a principal-agent problem. The lender is the ‘principal’ and the borrower is the ‘agent’. The principal-agent problem between borrower and lender is similar to the ‘somebody else’s money’ problem discussed in Unit 6. In that case, the manager of a firm (the agent) is making decisions about the use of the funds supplied by the firm’s investors (the principals), but they are not in a position to require him to act in a way that maximizes their wealth, rather than pursuing his own objectives.
In the case of borrowing and lending, it is often not possible for the lender (the principal) to write a contract that ensures a loan will be repaid by the borrower (the agent). The reason is that it is impossible for the lender to ensure by contract that the borrower will use the funds in a prudent way that will allow repayment according to the terms of the loan.
The table in Figure 10.19 compares two principal-agent problems.
| Actors | Conflict of interest over | Enforceable contract covers | Left out of contract (or unenforceable) | Result | |
|---|---|---|---|---|---|
| Labour market (Units 6 and 9) | Employer Employee |
Wages, work (quality and amount) | Wages, time, conditions | Work (quality and amount), duration of employment | Effort under-provided; unemployment |
| Credit market (Units 10 and 12) | Lender Borrower |
Interest rate, conduct of project (effort, prudence) | Interest rate | Effort, prudence, repayment | Too much risk, credit constraints |
Principal-agent problems: The credit market and the labour market.
Figure 10.19 Principal-agent problems: The credit market and the labour market.
One response of the lender to this conflict of interest is to require the borrower to put some of her wealth into the project (this is called equity). The more of the borrower’s own wealth is invested in the project, the more closely aligned her interests are with those of the lender. Another common response, whether the borrowers are home buyers in New Zealand or car buyers in New Orleans, is to require the borrower to set aside property that will be transferred to the lender if the loan is not repaid (this is called collateral).
Equity or collateral reduces the conflict of interest between the borrower and the lender. The reason is that when the borrower has some of her money (either equity or collateral) at stake:
- She has a greater interest in working hard: She will try harder to make prudent business decisions to ensure the project’s success.
- It is a signal to the lender: It signals that the borrower thinks that the project is of sufficient quality to succeed.
- credit rationing
- The process by which those with less wealth borrow on unfavourable terms, compared to those with more wealth.
But there is a hitch. If the borrower had been wealthy, she could either use her wealth as collateral and as equity in the project, or she could have been on the other side of the market, lending money. Typically the reason why the borrower needs a loan is that she is not wealthy. As a result, she may be unable to provide enough equity or collateral to sufficiently reduce the conflict of interest and hence the risk faced by the lender, and the lender refuses to offer a loan.
- credit-excluded
- A description of individuals who are unable to borrow on any terms. See also: credit-constrained.
- credit-constrained
- A description of individuals who are able to borrow only on unfavourable terms. See also: credit-excluded.
This is called credit rationing: those with less wealth borrow on unfavourable terms compared with those with more wealth, or are refused loans entirely.
Borrowers whose limited wealth makes it impossible to get a loan at any interest rate are termed credit-excluded. Those who borrow, but only on unfavourable terms, are termed credit-constrained. Both are sometimes said to be wealth-constrained, meaning that their wealth limits their credit market opportunities. Adam Smith had credit rationing in mind when he wrote:
Money, says the proverb, makes money. When you have got a little it is often easy to get more. The great difficulty is to get that little. (An Inquiry into the Nature and Causes of the Wealth of Nations, 1776)8
The relationship between wealth and credit is summarized in Figure 10.20.
The exclusion of those without wealth from credit markets or their borrowing on unfavourable terms is evident in these facts:
- In a survey, one in eight US families had their request for credit rejected by a financial institution: The assets of these credit-constrained families were 63% lower than the unconstrained families. ‘Discouraged borrowers’ (those who did not apply for a loan because they expected to be rejected) had even lower wealth than the rejected applicants.
- Credit card borrowing limits are often increased automatically: If borrowing increases in response to an automatic change in the borrowing limit, we can conclude that the individual was credit-constrained. The authors of this study suggested that approximately two-thirds of US families may be credit-constrained or excluded.9
- Inheritance leads the self-employed to considerably increase the scale of their operations: An inheritance of £5,000 in 1981 (around $24,000 today) doubled a typical British youth’s likelihood of setting up a business.
- Owning a house can be used as collateral: A 10% rise in value of housing assets that could be used as collateral to secure loans in the UK increases the number of startup businesses by 5%.
- Asset-poor people in the US frequently take out short-term ‘payday loans’: In the state of Illinois, the typical short-term borrower is a low-income woman in her mid-thirties ($24,104 annual income), living in rental housing, borrowing between $100 and $200, and paying an average annual rate of interest of 486%.
- Poor and middle-income Indian farmers could substantially raise their incomes if they did not face credit constraints: Not only do they generally underinvest in productive assets, but the assets they hold are biased towards those they can sell in times of need (bullocks) and against highly profitable equipment (irrigation pumps), which have little resale value.10
Question 10.11 Choose the correct answer(s)
Which of the following statements are correct regarding the principal-agent problem?
- A principal-agent problem exists in loans due to the asymmetric information regarding the borrower’s effort or the quality of the project.
- The principal-agent problem exists because one cannot write a binding contract for full effort.
- Equity implies that the agent has more to lose if the project fails, reducing the difference in the incentives between the principal and the agent.
- This occurs because some otherwise-viable projects will not be funded owing to the principal-agent problem. In particular, those with few assets or little wealth, who cannot afford to put in equity or provide collateral, will be more likely to be credit rationed because of the principal agent problem.
Exercise 10.7 Microfinance and lending to the poor
Read the paper ‘The Microfinance Promise’.11 The Grameen Bank in Bangladesh makes loans available to groups of individuals who together apply for individual loans, under the condition that the loans to the group members will be renewed in the future if (but only if) each member has repaid the loan on schedule.
Explain how you think such an arrangement would affect the borrower’s decision about what to spend the money on, and how hard she will work to make sure that repayment is possible.
10.13 Inequality: Lenders, borrowers, and those excluded from credit markets
Long before there were the employers, employees, and the unemployed that we studied in the previous unit, there were lenders and borrowers. Some of the first written records of any kind were records of debts. Differences in income between those who lend (people like Marco) and those who borrow (people like Julia) remain an important source of economic inequality today.
We can analyse inequalities between borrowers and lenders (and among the borrowing class) using the same Lorenz curve and Gini coefficient model that we used to study inequality among employers and employees.
Here is an illustration. An economy is composed of 90 farmers who borrow from 10 lenders, and use the funds to finance the planting and tending of their crops. The harvest (on average) is sold for an amount greater than the farmer’s loan, so that for every euro borrowed and invested the farmer gains income of 1 + Π, where Π is called the rate of profit.
Following the harvest, the farmers repay the loans with interest, at rate i. We simplify by assuming that all of the loans are repaid and that all lenders lend the same amount to the farmers at the same interest rate.
Since each euro invested produces total revenue of 1 + Π, each farmer produces income (revenue less costs) of Π. But this income is divided between the lender, who receives an income of i for every euro lent, and the borrower who receives the remainder, namely Π − i. So the lender receives a share of i/Π of total output, and the borrower receives a share of 1 − (i/Π).
Thus if i = 0.10 and Π = 0.15 then the lenders’ share of total income is 2/3 and the borrowers’ is 1/3.
Inequality in this economy is depicted in Figure 10.21. The Gini coefficient is 0.57.
In the previous sections we showed why some would-be borrowers (those unable to post collateral or lacking their own funds to finance a project) might be excluded entirely from borrowing even if they would be willing to pay the interest rate. How does this affect the Lorenz curve and the Gini coefficient?
To explore this, imagine that 40 of the prospective borrowers are excluded (and since they cannot borrow, they receive no income at all) and that nothing else in the situation changes (i and Π remain unchanged).
The dashed line in Figure 10.21 shows the new situation. The new Gini coefficient is 0.70, showing an increase in inequality as the result of the credit market exclusion of the poor.
Question 10.12 Choose the correct answer(s)
In an economy with a population of 100, there are 80 farmers and 20 lenders. The farmers use the funds to finance the planting and tending of their crops. The rate of profit for the harvest is 12.5%, while the interest rate charged is 10%. Compare the following two cases:
- Case A: All farmers are able to borrow.
- Case B: Only 50 farmers are able to borrow.
Based on this information, which of the following statements is correct?
- The farmers keep 12.5 – 10 = 2.5% of the 12.5% profit rate. This is a 2.5/12.5 = 20% share.
- The Gini coefficient for Case A is 0.6.
- The Gini coefficient for Case B is 0.7.
- 0.7 is 16.7% higher than 0.6.
This example illustrates the fact that one cause of inequality in an economy is that some people (like Marco) are in a position to profit by lending money to others, just as others (like Bruno in Unit 5) are in a position to profit by employing others.
Bruno and Marco are probably not the best-loved characters in the economy. For similar reasons, banks are not the most popular or trusted institutions. In the US, for example, 73% of people expressed ‘a great deal’ or ‘quite a lot’ of confidence in the military in 2016, exactly the same as the level a decade earlier. By contrast, in 2016, only 27% expressed a degree of confidence in banks, down from 49% a decade earlier. Surveys show that the public in Germany, Spain and many other countries hold their banks in low esteem. This has particularly been the case since the financial crisis of 2008.
It is sometimes said that rich people lend on terms that make them rich, while poor people borrow on terms that make them poor. Our example of Julia and Marco made it clear that one’s view of the interest rate—as a cost for Julia and as a source of income for Marco—depends on one’s wealth. People with limited wealth are credit-constrained, which limits their ability to profit from the investment opportunities that are open to those with more assets.
It is also true that, in determining the rate of interest at which an individual will borrow, the lender often has superior bargaining power, and so can set a rate that enables him to capture most of the mutual gains from the transaction.
But do banks and the financial system make some people poor and other people rich? To answer this question, compare banks to other profit-making firms. Both are owned by wealthy people, who profit from the business they do with poorer people. Moreover, they often transact on terms (rates of interest, wages) that perpetuate the lack of wealth of borrowers and employees.
Exercise 10.8 Unpopular banks
Why do you think that banks tend to be more unpopular than other profit-making firms (Honda or Microsoft, for example)?
But even those who dislike banks do not think that the less wealthy would be better off in their absence, any more than that the less wealthy would benefit if firms ceased to employ labour. Banks, credit, and money are essential to a modern economy—including to the economic opportunities of the less well off—because they provide opportunities for mutual gains that occur when people can benefit by moving their buying power from one time period to another, either borrowing (moving it to the present) or lending (the opposite).
Exercise 10.9 Limits on lending
Many countries have policies that limit how much interest a moneylender can charge on a loan.
- Do you think these limits are a good idea?
- Who benefits from the laws and who loses?
- What are likely to be the long-term effects of such laws?
- Contrast this approach to helping the poor gain access to loans with the Grameen Bank in Exercise 10.7.
10.14 Conclusion
As the Irish bank closure showed, money and credit are so fundamental to economic interactions that people find ways to recreate money even when formal institutions fail. Indeed, archaeologists have discovered evidence of lending and the use of money to denominate debts and to facilitate exchange, from long before banks or governments existed. This is because substantial mutual gains are made possible when a group of people develop sufficient trust in each other and in a particular medium of exchange.
In modern economies, the creation of money is inextricably tied up with the creation of credit, or the process of lending by commercial banks whose actions are regulated by government and managed by the central bank. Borrowing and lending allows people to smooth consumption when they have irregular incomes, to satisfy their impatience, or to finance investment that can increase their future consumption possibilities. The credit market produces mutual gains for borrowers and lenders but, like many economic transactions, the distribution of those gains via the interest rate represents a conflict of interest.
Concepts introduced in Unit 10
Before you move on, review these definitions:
- Money, broad money, base money, bank money
- Wealth
- Income
- Diminishing marginal returns to consumption
- A person’s discount rate
- Pure impatience
- Collateral
- Balance sheet, assets, liabilities, net worth, equity, solvency
- Leverage ratio
- Credit-constrained, credit-excluded
- The central bank’s policy interest rate
10.15 References
- Aleem, Irfan. 1990. ‘Imperfect information, screening, and the costs of informal lending: A study of a rural credit market in Pakistan’. The World Bank Economic Review 4 (3): pp. 329–349.
- Bowles, Samuel. 2006. Microeconomics: Behavior, institutions, and evolution (the roundtable series in behavioral economics). Princeton, NJ: Princeton University Press.
- Carlin, Wendy and David Soskice. 2015. Macroeconomics: Institutions, Instability, and the Financial System. Oxford: Oxford University Press. Chapters 5 and 6.
- Graeber, David. 2012. ‘The Myth of Barter’. In Debt: The First 5,000 years. Brooklyn, NY: Melville House Publishing.
- Gross, David, and Nicholas Souleles. 2002. ‘Do Liquidity Constraints and Interest Rates Matter for Consumer Behavior? Evidence from Credit Card Data’. The Quarterly Journal of Economics 117 (1) (February): pp. 149–185.
- Martin, Felix. 2013. Money: The Unauthorised Biography. London: The Bodley Head.
- Morduch, Jonathan. 1999. ‘The Microfinance Promise’. Journal of Economic Literature 37 (4) (December): pp. 1569–1614.
- Murphy, Antoin E. 1978. ‘Money in an Economy Without Banks: The Case of Ireland’. The Manchester School 46 (1) (March): pp. 41–50.
- Silver-Greenberg, Jessica. 2014. ‘New York Prosecutors Charge Payday Loan Firms with Usury’. DealBook.
- Spaliara, Marina-Eliza. 2009. ‘Do Financial Factors Affect the Capital–labour Ratio? Evidence from UK Firm-level Data’. Journal of Banking & Finance 33 (10) (October): pp. 1932–1947.
- The Economist. 2012. ‘The Fear Factor’. Updated 2 June 2012.
-
Irfan Aleem. 1990. ‘Imperfect information, screening, and the costs of informal lending: A study of a rural credit market in Pakistan’. The World Bank Economic Review 4 (3): pp. 329–349. ↩
-
Jessica Silver-Greenberg. 2014. ‘New York Prosecutors Charge Payday Loan Firms with Usury’. DealBook. ↩
-
Felix Martin. 2013. Money: The Unauthorised Biography. London: The Bodley Head. ↩
-
Antoin E. Murphy. 1978. ‘Money in an Economy without Banks: The Case of Ireland’. The Manchester School 46 (1) (March): pp. 41–50. ↩
-
Jonathan Morduch. 1999. ‘The Microfinance Promise’. Journal of Economic Literature 37 (4) (December): pp. 1569–1614. ↩
-
David Graeber. 2012. ‘The Myth of Barter’. Debt: The First 5,000 years. Brooklyn, NY: Melville House Publishing. ↩
-
‘The Fear Factor’. The Economist. Updated 2 June 2012. ↩
-
Adam Smith, ‘Of the Profits of Stock’. In An Inquiry into the Nature and Causes of the Wealth of Nations, 1776. ↩
-
David Gross and Nicholas Souleles. 2002. ‘Do Liquidity Constraints and Interest Rates Matter for Consumer Behavior? Evidence from Credit Card Data’. The Quarterly Journal of Economics 117 (1) (February): pp. 149–185. ↩
-
Samuel Bowles. 2006. Microeconomics: Behavior, Institutions, and Evolution (the Roundtable Series in Behavioral Economics). Princeton, NJ: Princeton University Press. ↩
-
Jonathan Morduch. 1999. ‘The Microfinance Promise’. Journal of Economic Literature 37 (4) (December): pp. 1569–1614. ↩

